Opni Alerting : User Guide
This guide walks through the usage of Opni-Alerting.
There are 3 main components to Opni-Alerting:
- Endpoints : targets for alarms to dispatch to
- Alarms : Expressions that specify some condition to alert on
- Overview : Timeline of breached conditions
Prerequisites
- Access to the admin UI
- Opni-Alerting backend is installed
Endpoints
In order to get started, head to the 'Endpoints' tab under 'Alerting' in the left sidebar of the admin UI
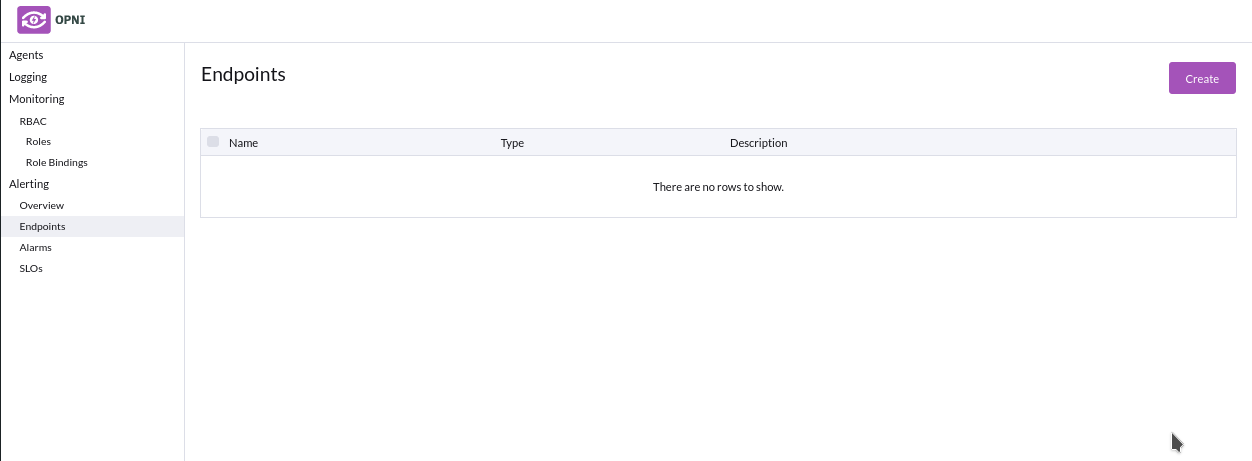
To create a new endpoint, click the top-right 'Create' button to open the create UI
Slack
Using slack requires a :
- Valid incoming slack webhook
- Valid slack channel
See the official slack docs for setup instructions
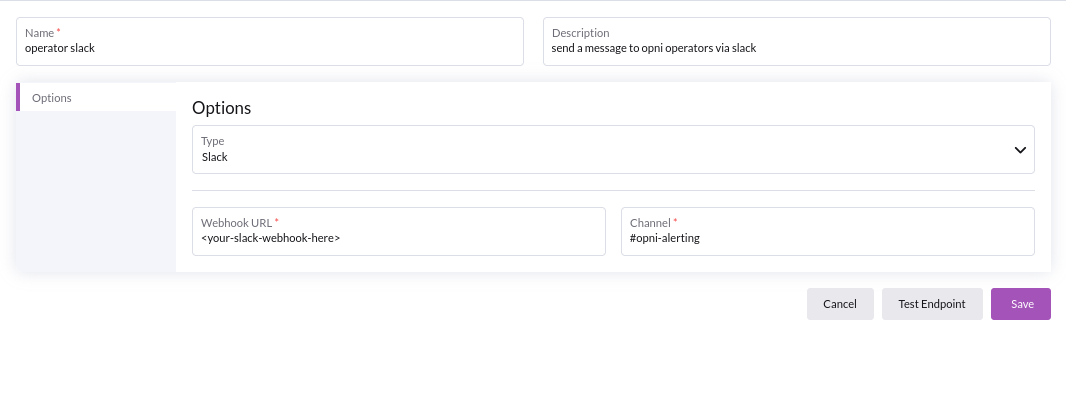
If the specified channel does not exist, or your slackbot does not have appropriate permissions to send messages to the specified channel, it will send the alert to its default channel.
To validate your inputs, hit the 'Test Endpoint' button to make sure opni alerting can dispatch messages to your configured endpoint.
If your inputs are correct, you should receive a test message:

When you are done, hit the 'Save' button.
Email
Using email endpoint requires its own smtp server, which will require:
- To email : valid recipient for this endpoint
- From email : valid sender for this email
- Smart Host :
<url>:<port>for your SMTP server setup - Smtp Identity : Identity to use with your SMTP server
- Smtp username : Auth username credential for SMTP server
- Smtp Password : Auth password credential for SMTP server
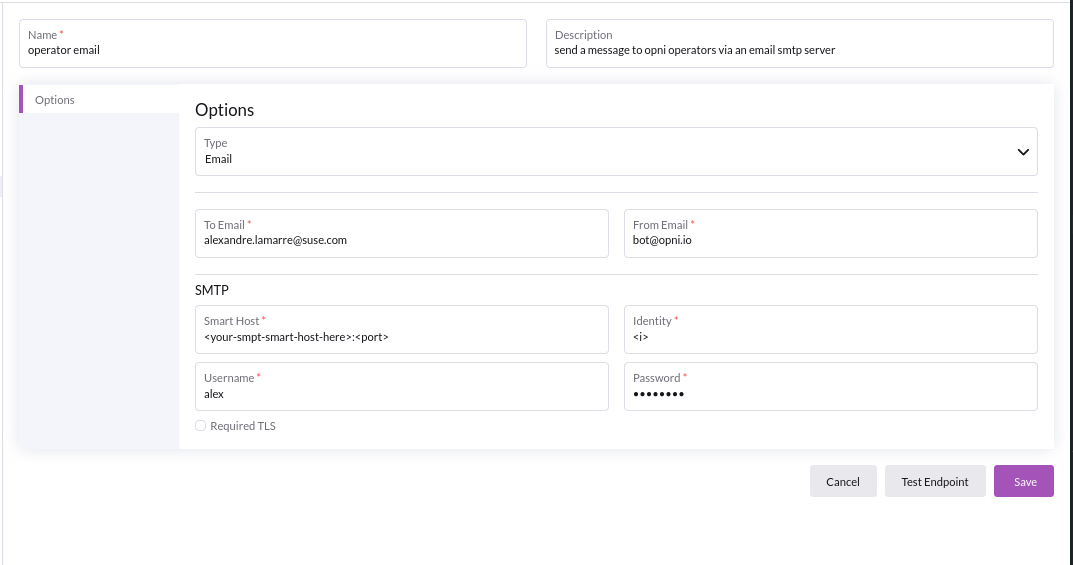
SMTP server configurations will be specific to your IT or production setup
To validate your inputs, hit the 'Test Endpoint' button to make sure opni alerting can dispatch messages to your configured endpoint.
When you are done, hit the 'Save' button.
PagerDuty
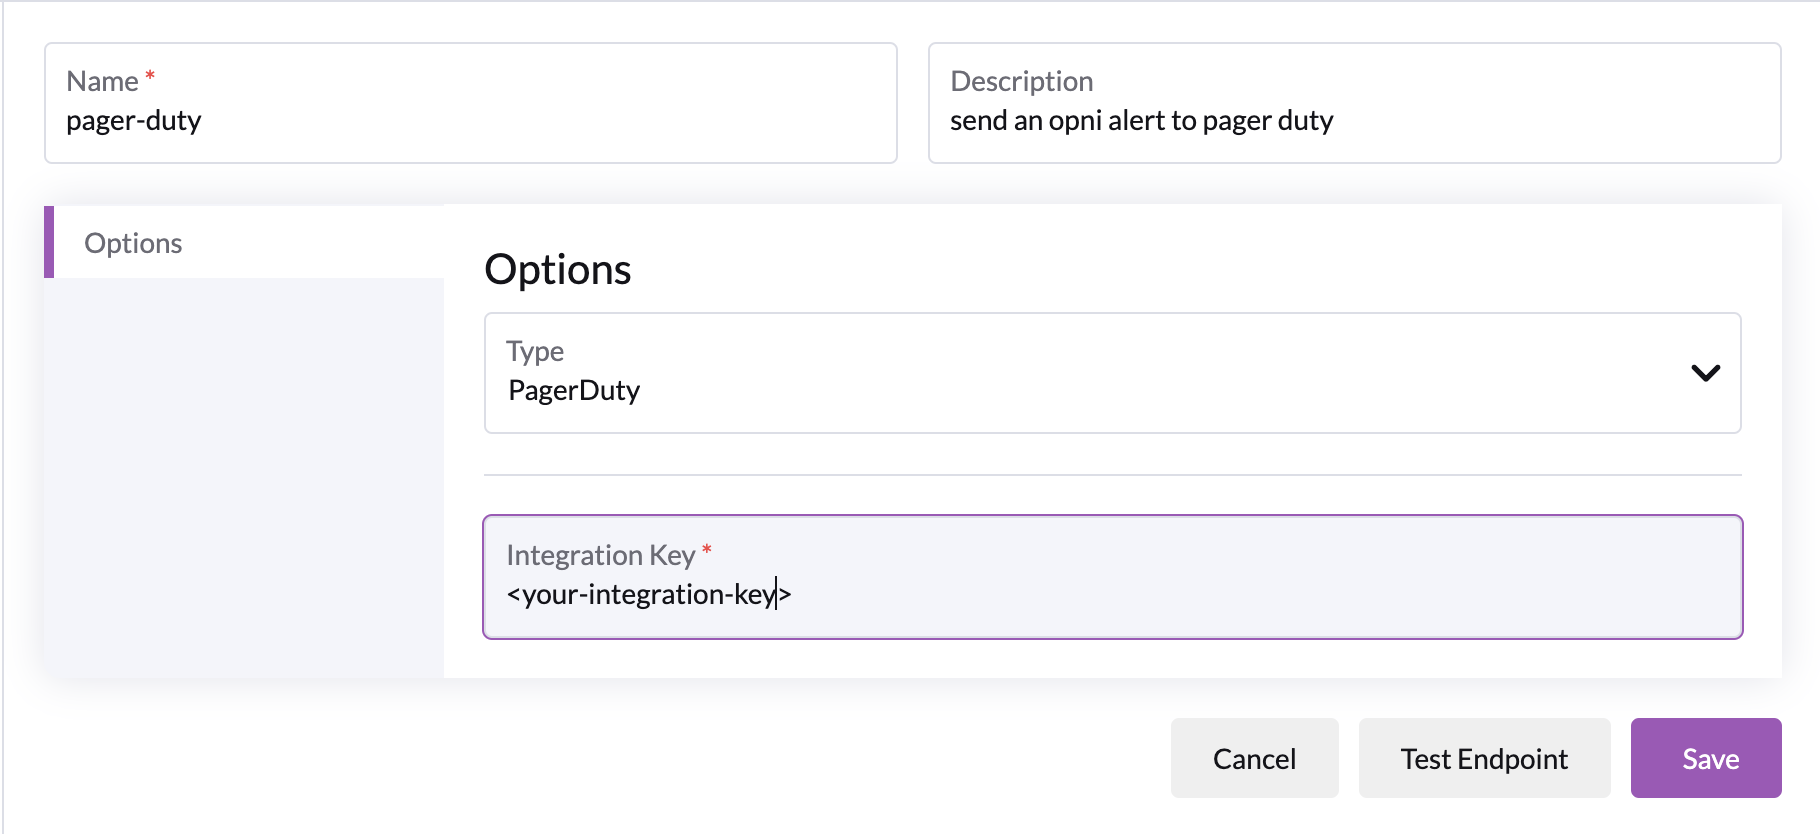
Using PagerDuty requires a PagerDuty integration key.
See the official PagerDuty docs on integration with AlertManager for generating integration keys
Alarms
Alarms are used to evaluate whether or not some external condition should dispatch a notification to the configured endpoints
Alarms will fire without attached endpoints, but if you do not attach any endpoints to your alarm it will not dispatch to any endpoints (it will still show as firing in the opni UI).
State
- Unkown : State can't be reported or analyzed by Opni-Alerting
- Ok : The alarm is fine
- Firing : The alarm has met its condition, expect to eventually receive a notification, depending on your settings
- Silenced : The alarm is firing but has been silence by the User.
- Invalidated : The alarm can no longer evaluate to Ok or Firing, usually due to uninstalling external requirements.
Overview
Overview tab will display a timeline of when alarms have fired.

Editing / Deleting Alarms
In order to edit or delete alarms right click the condition you want to edit or delete :

Cloning
Cloning alarms with specific external requirements to other cluster(s) may result in invalidated state alerts if those requirements are not met by the target cluster(s)
As above, you can right click the alarm you want to clone, which will open a menu to select which clusters you want to clone to.
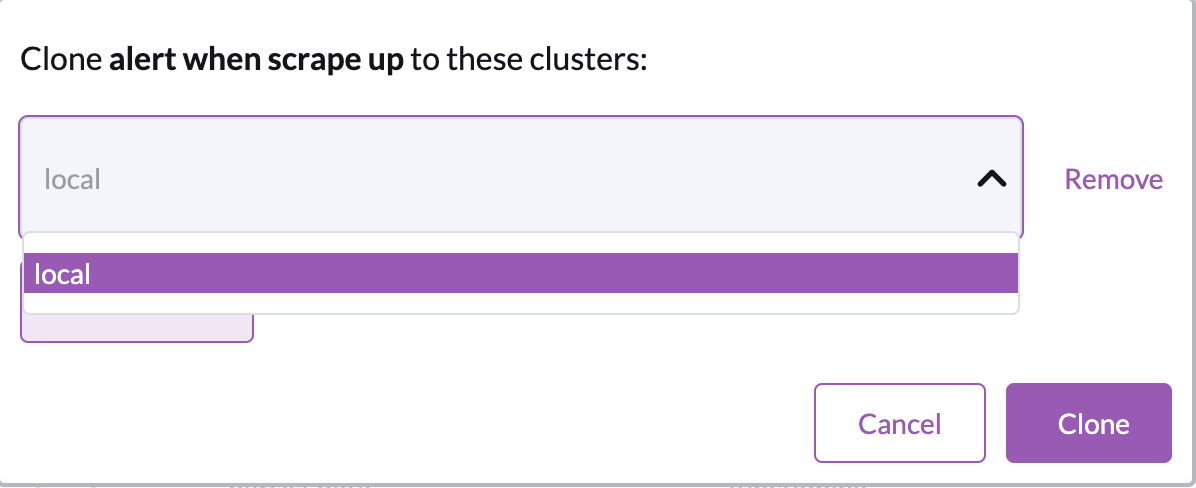
You are allowed to clone to the same cluster, as well as clone any number of times to any cluster.
Alarm Types
Agent Disconnect
Alerts when an agent disconnects within the specified timeout.
By default, whenever an agent is bootstrapped, for example consider this agent :

A matching agent disconnect condition is created with a 10 minute timeout.

You are free to edit or delete this default condition as you see fit.
Options

- Cluster : agent this alarm applies to
- Timeout : how long this agent has been disconnect before firing an alarm
Recommended Options
- Timeout : 10 or more minutes
Downstream Capability
Alerts when an agent capability, e.g. Logging or Metrics, is in some unhealthy state for a certain amount of time.
By default when an agent is bootstrapped, a matching downstream capability alarm is created that will alert if any unhealthy state is sustained over a period of 10 minutes.

You are free to edit or delete this default condition as you see fit.
Options
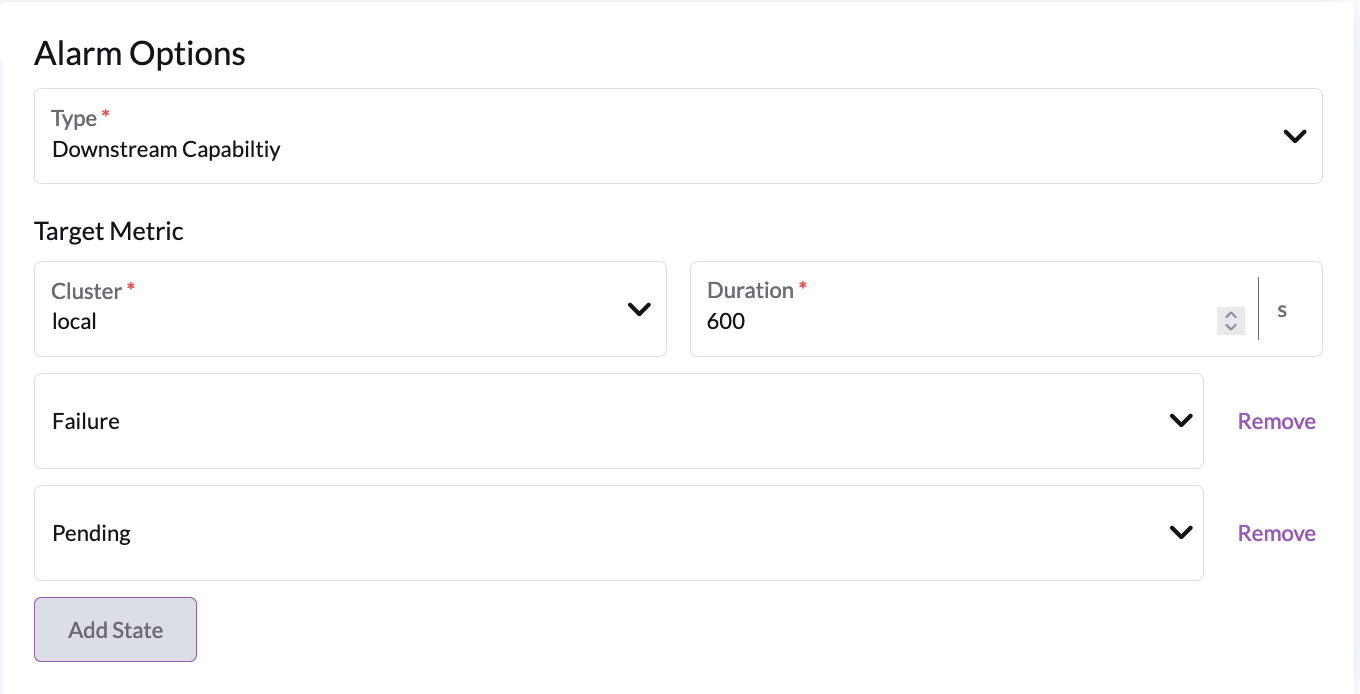
- Cluster : cluster this applies to
- Duration : period after which we decide to fire an alaram
- One ore more capability states to track :
Failure: An agent capability is experiencing errorsPending: A setup step or sync operation is hanging
Recommended Options
- Duration : 10 or more minutes
Monitoring Backend
Requires the monitoring backend to be installed
Alerts when the specified monitoring backend components are in an unhealthy state over some period of time
Options
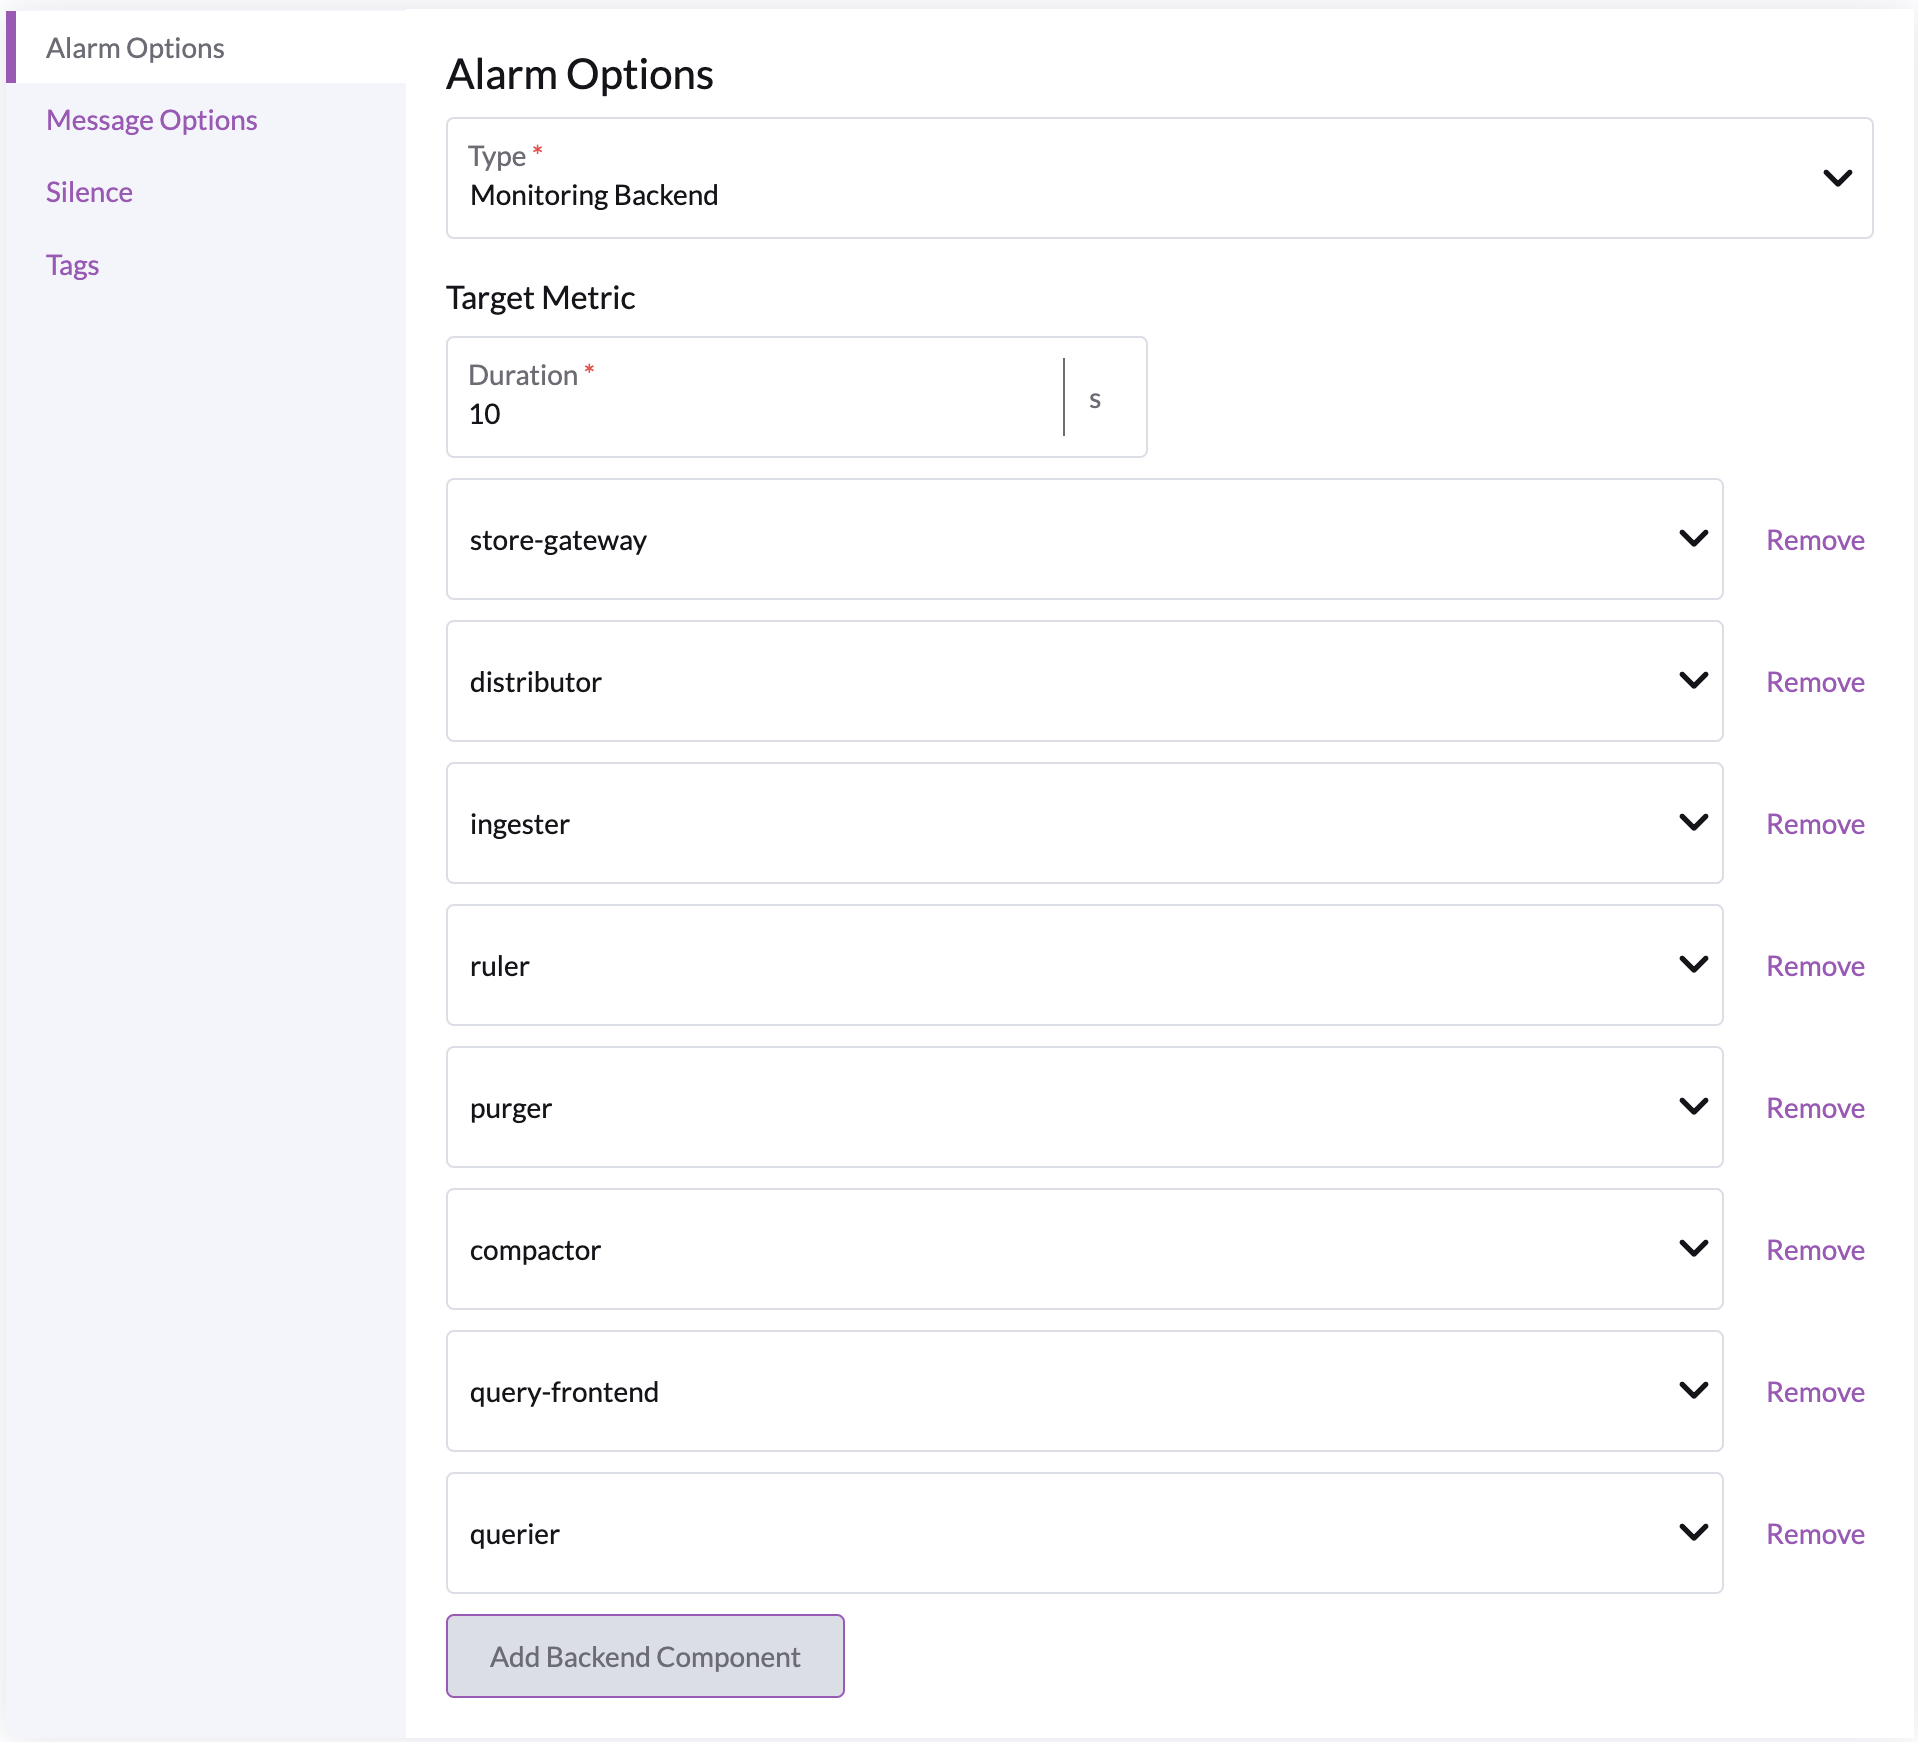
- Duration : period after which we should fire an alarm if the specified backend components are unhealthy, recommended to be 10 minutes or more
- Backend components :
store-gateway: responsible for persistent & remote storage, critical component.distributor: responsible for distributing remote writes to the ingesteringester: responsible for (persistent) buffering of incoming dataruler: responsible for applying stored prometheus queries and prometheus alertspurger: responsible for deleting cluster datacompactor: responsible for buffer compaction before sending to persistent storagequery-frontend: "api gateway" for the querierquerier: handles prometheus queries from the user
Recommended options
- Duration : 10 minutes or more, but no more than 90 mins
- Backend Components :
- track
store-gateway,distributor,ingester&compactoras a high severity alarm - track all components as a lesser severity alarm
- track
Prometheus Query
Alerts when the given prometheus query evaluates to True
Requires the monitoring backend to be installed & one or more downstream agents to have the metrics capability.
Options
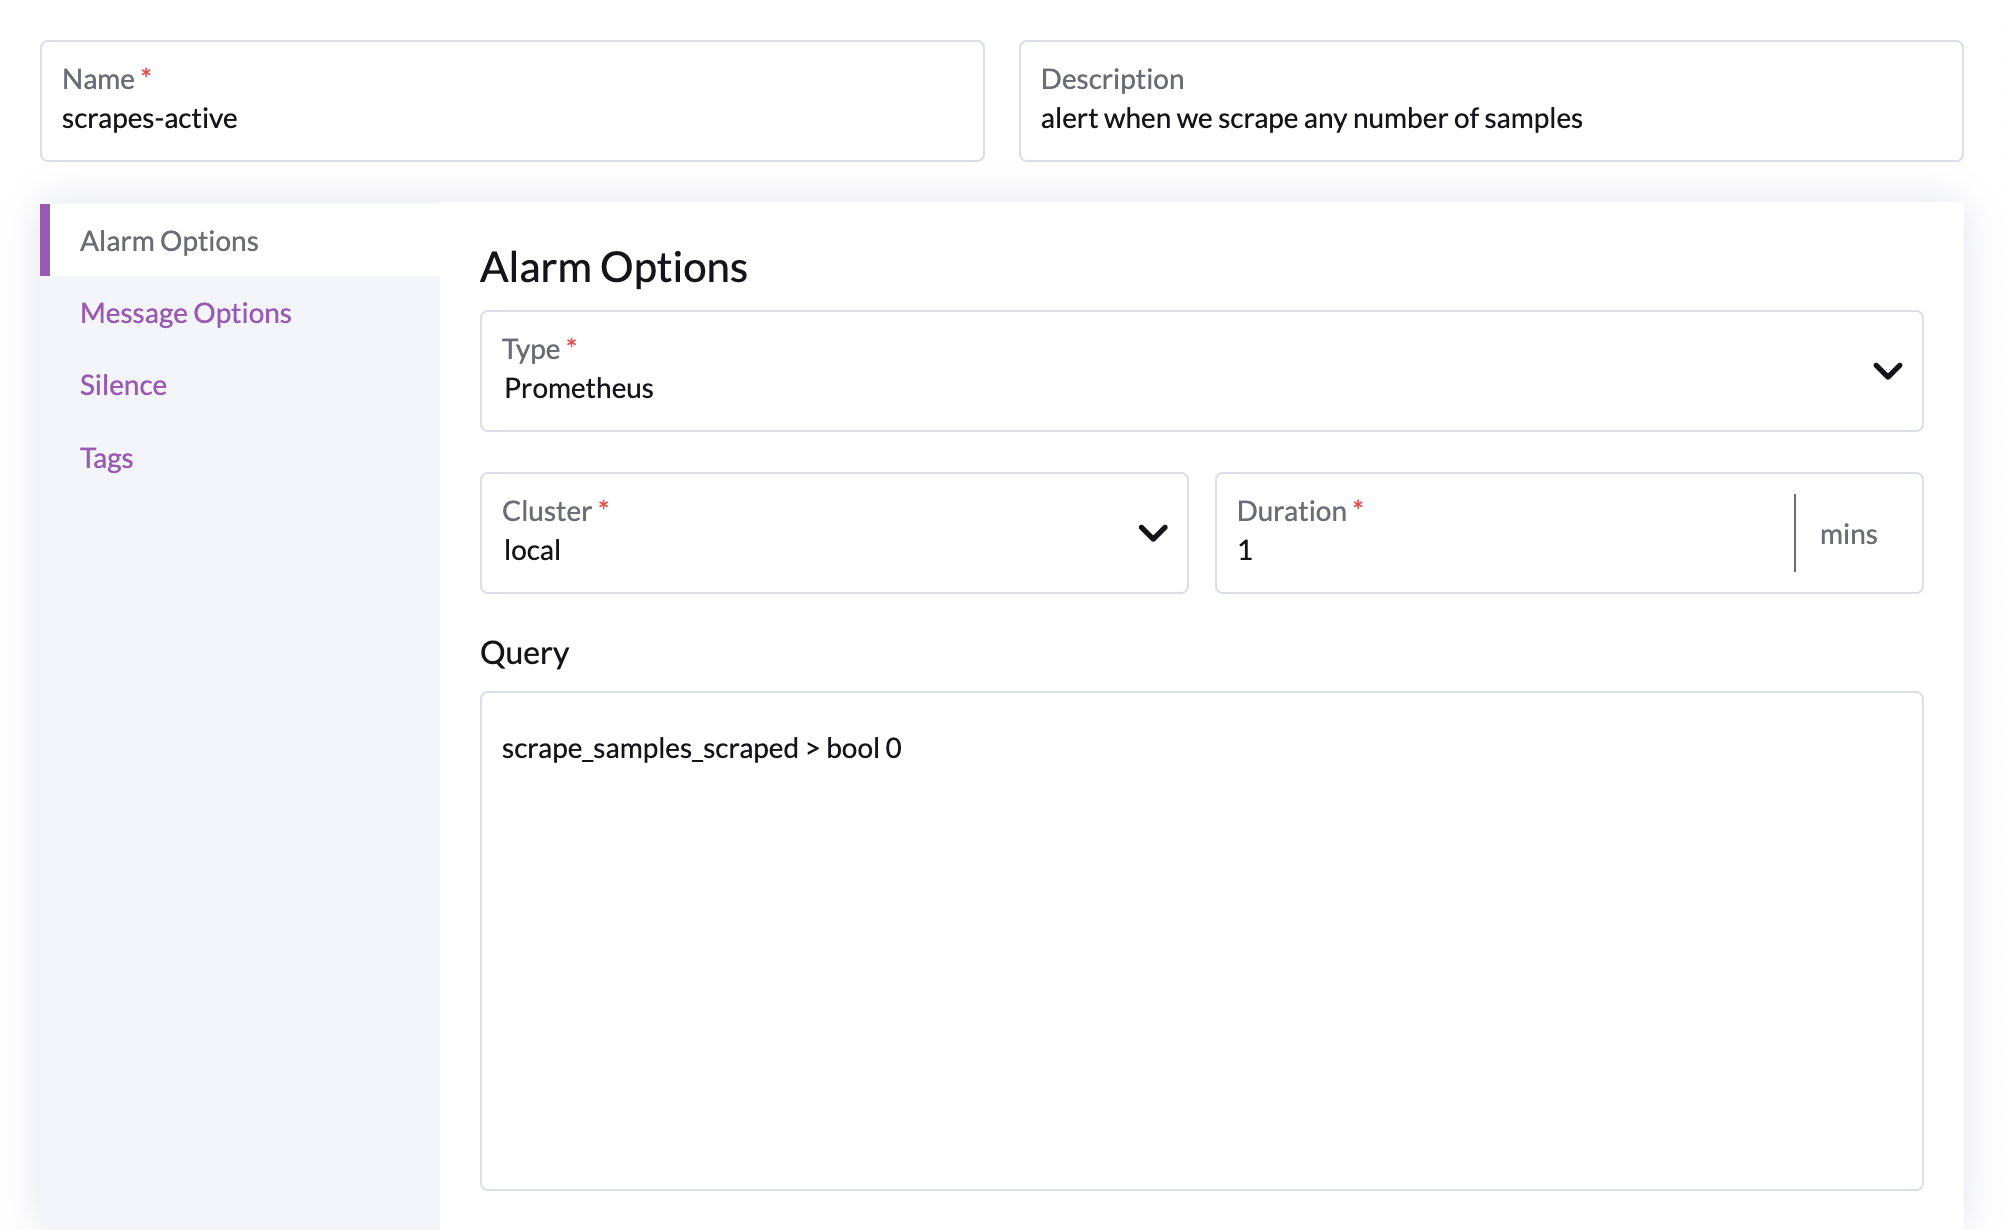
The above query should always evaluate to true, and subsequently evaluate to firing. It can be used to sanity check your downstream agents with metrics installed.
- Cluster : any cluster with an agent with metrics capabilities
- Duration : period after which we should fire an alert
- Query : any valid prometheus query
Kube State
Requires the monitoring backend to be installed and have one or more agents that have both metrics capabilities and kube-state-metrics enabled.
Alerts when the desired kubernetes object on the cluster is in the state specified by the user for a certain amount of time.
Options
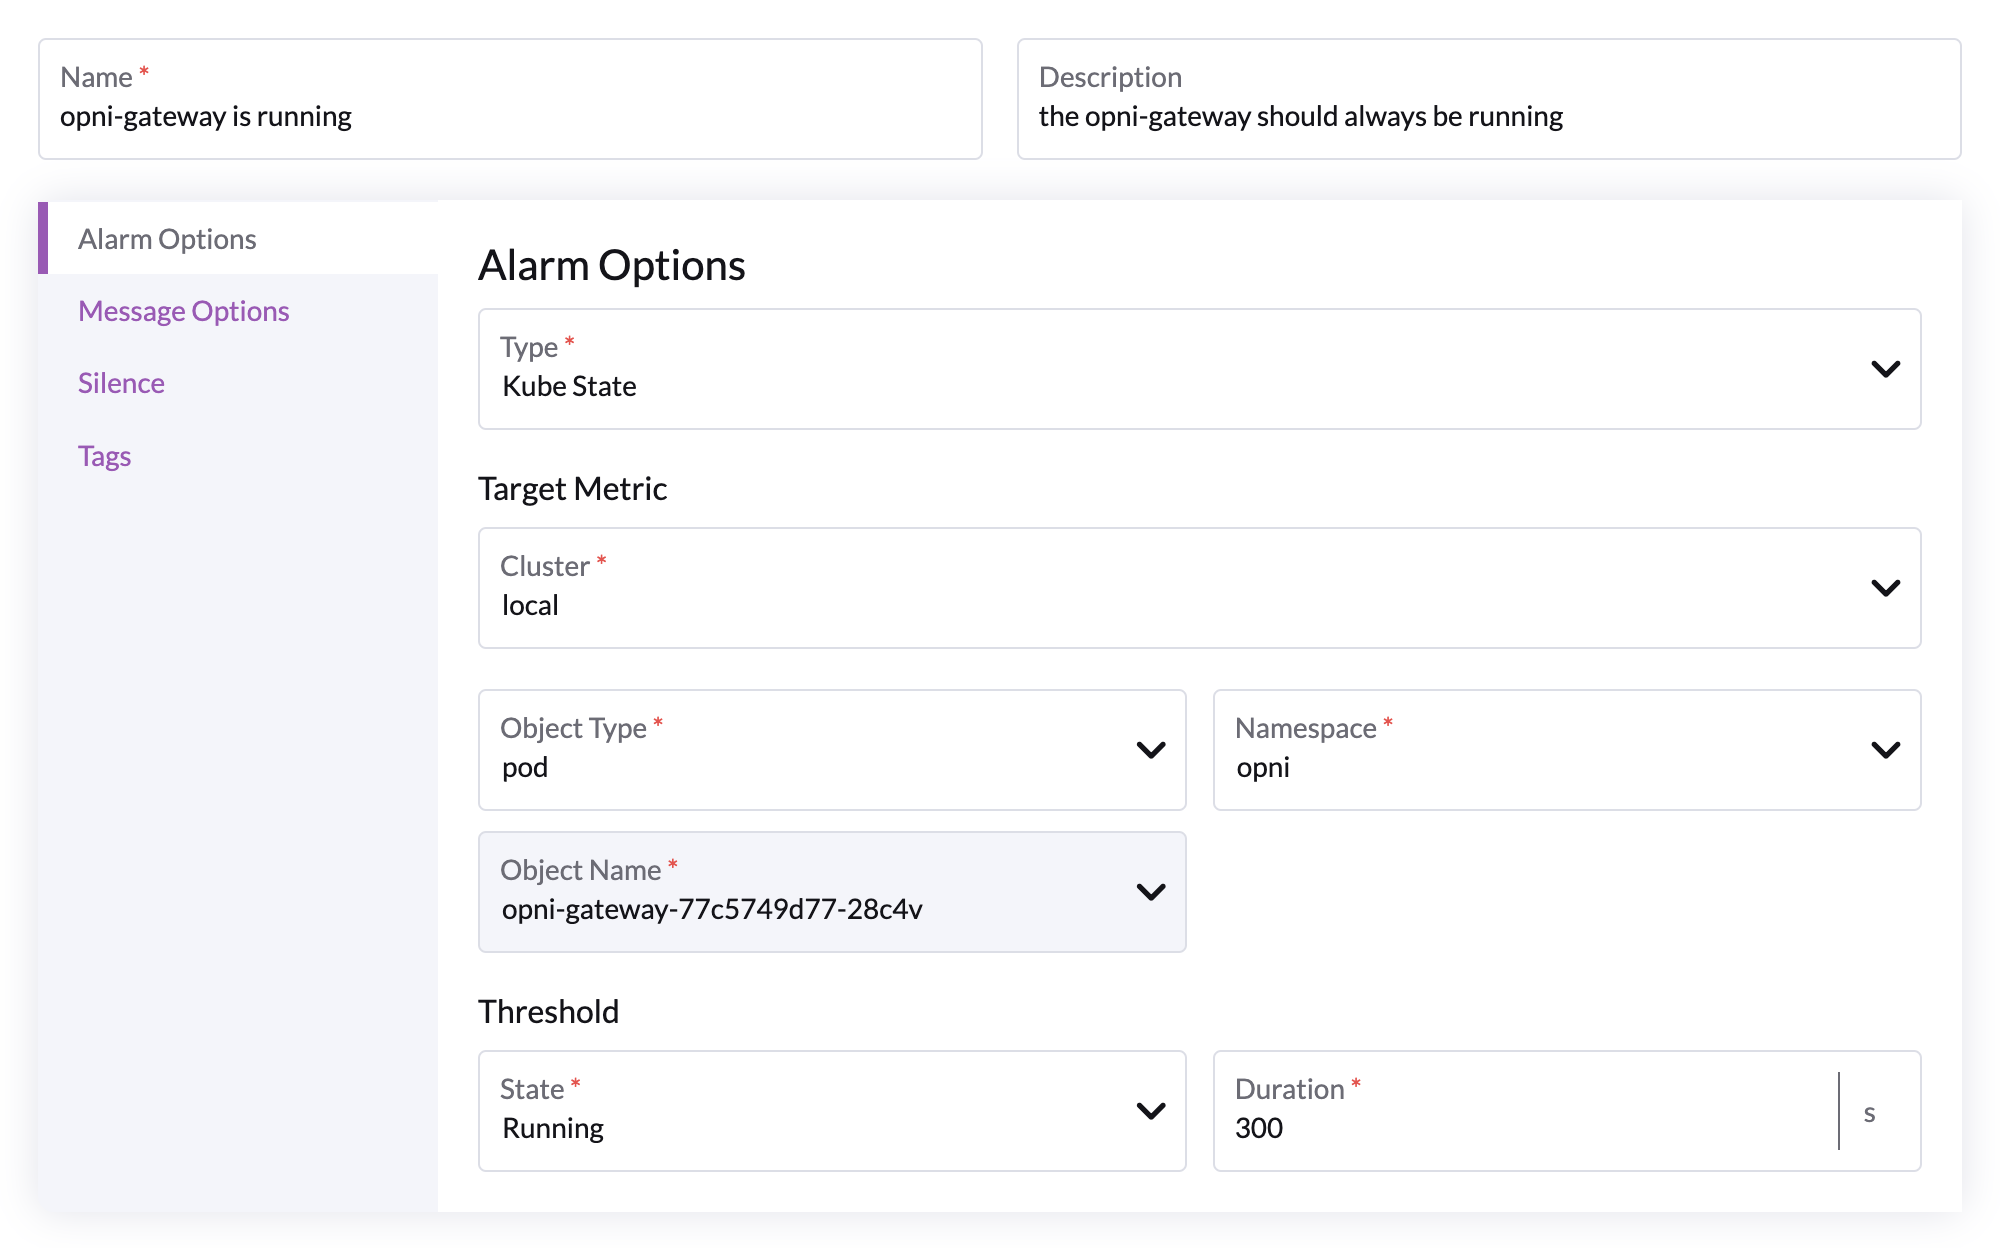
The above configuration will alert if the opni gateway is in fact running for more than 5 minutes.
It can be used to sanity check that your kube-state-metrics are working as intended.
General Alarm Options
Attaching endpoint(s) to an Alarm
Right click edit your condition, and navigate to the message options tab in the edit UI & click 'Add Endpoint'

From here you can add a list of your configured endpoints to your alarm:

You must specify Message options for the contents & dispatching configuration to your endpoint :
- Title : header for your particular endpoint
- Body : content of the message
- Initial Delay : time for backend to wait before sending alert
- Repeat interval : how often to repeat the alert when it fires
- Throttling duration : Throttle (delay) all alerts received from the same source by X minutes
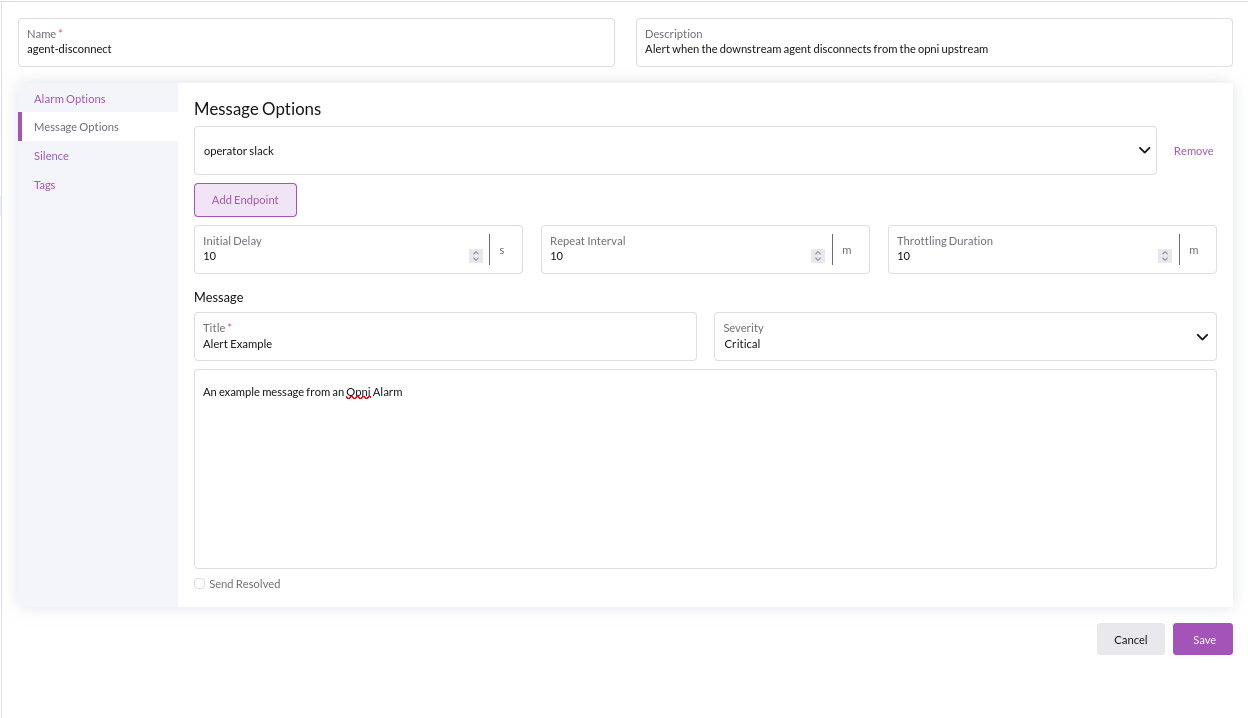
Based on the implementation details above, once we hit 'Save' and our downstream agent has disconnected for > 10mins, you will receive an alert:

Silencing an Alarm
If operators with to silence a firing alarm, which will cause the alarm to no longer send any notifications to endpoints, then consider :

They can do so by right clicking edit and navigating to the silence tab:

Once the alarm is silenced, operators can always un-silence it by clicking the resume now.
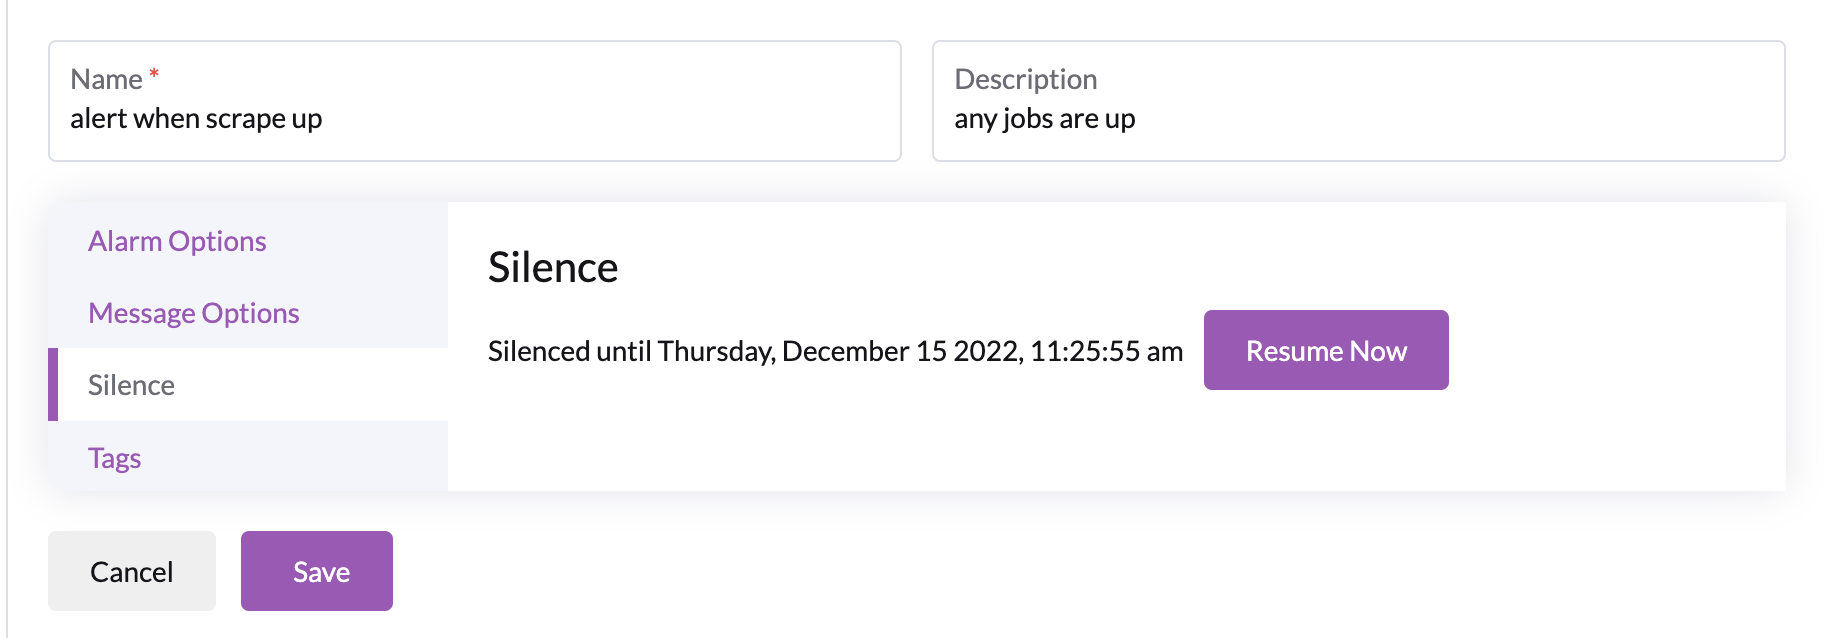
Tada! the alarm is silenced.

You can silence alarms that are not in the firing state, and they will prevent any notifications from being sent to endpoints if that alarm does enter the firing state