Prometheus Data Import
This guide walks you through importing the metrics data stored by an existing Rancher Monitoring installation.
Prerequisites
You will need to have the following installed:
- A K8s cluster
- Opni Gateway
- Opni Agent
- Opni Metrics backend
If the target cluster has a pre-existing PrometheusOperator installed, be sure to check Dealing with Prometheus Operator first.
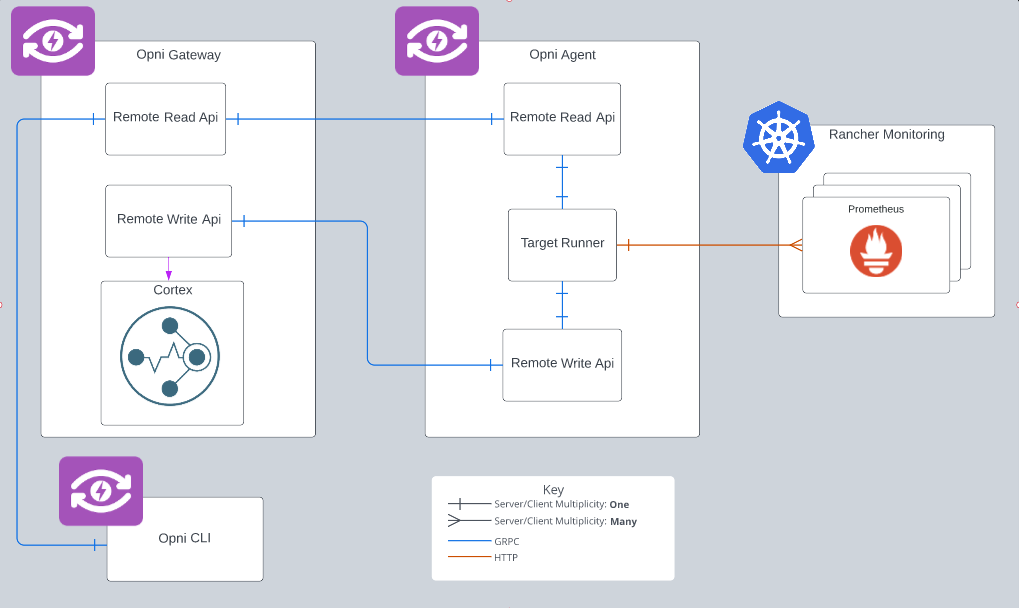
Architecture
Adding Targets
The first step to importing Prometheus data is to point Opni at the Prometheus deployments to read data from. To do this you can create an import target using opni import add <cluster> <name> <endpoint>. Import targets must have a unique cluster and name combination, so that they can be identified later.
When adding targets it is important to note that while the add request is sent to the gateway, the target endpoint needs to be reachable by the agent and not the gateway.
If you do not know what prometheus services / endpoints exist on your cluster, Opni provides best effort attempt to discover these targets. Opni will check the cluster for any prometheuses.monitoring.coreos.com and report the urls for the related service:
>>> opni import discover
 CLUSTER                               NAME                           EXTERNAL                                                            INTERNAL
 0194fdc2-fa2f-4cc0-81d3-ff12045b73c8  rancher-monitoring-prometheus  http://rancher-monitoring-prometheus.cattle-monitoring-system:9090  rancher-monitoring-prometheus.cattle-monitoring-system.svc.cluster.local
You will need to add the url scheme, port, and endpoint path yourself.
Starting an Import
First you should list the available targets:
> opni import list
 CLUSTER                               NAME                ENDPOINT                                                                   LAST READ  STATE        MESSAGE
 0194fdc2-fa2f-4cc0-81d3-ff12045b73c8  demo                http://127.0.0.1:8090/api/v1/read                                                     not running
 0194fdc2-fa2f-4cc0-81d3-ff12045b73c8  rancher-monitoring  rancher-monitoring-prometheus.cattle-monitoring-service.svc.cluster.local             not running
When starting an import, there are a handful of options available you can use to add constraints to the import. You can specify the time range for the import using the --start and --end flags, or add a PromQL using the --filters flag. Once you know which target to start and what constraints you might want, you can start the import with bpni import start <cluste> <name>. There is no limit to how many imports you can run at once.
You can start and follow the import progress in one command with the --follow flag:
> opni import start --follow 0194fdc2-fa2f-4cc0-81d3-ff12045b73c8 demo
2023-02-02T13:42:55-05:00 INFO commands/import.go:284 import started

  ███████████████████████████████████████████████████████████████████████████ 100%

  State: complete
  Last Read Timestamp: 2023-02-02 18:42:55 +0000 UTC
This is essentially the same as running opni import start 0194fdc2-fa2f-4cc0-81d3-ff12045b73c8 demo && opni import progress 0194fdc2-fa2f-4cc0-81d3-ff12045b73c8 demo
Checking Progress
Once you have started your imports, there are two ways you can use to check the state of the import.
- Running
opni import listwill give you a high level representation of your import state:
CLUSTER                               NAME                ENDPOINT                                                                          LAST READ                      STATE     MESSAGE
0194fdc2-fa2f-4cc0-81d3-ff12045b73c8  demo                http://127.0.0.1:8090/api/v1/read                                                 2023-02-02 17:49:49 +0000 UTC  complete
0194fdc2-fa2f-4cc0-81d3-ff12045b73c8  rancher-monitoring  http://rancher-monitoring-prometheus.cattle-monitoring-service.svc.cluster.local  1970-01-01 00:00:00 +0000 UTC  failed    failed to read from target endpoint: could not get response from remote read: connection refused
- Running
opni import progress <cluster> <name>will follow the import progress, and show clearer progress and status information:
  ███████████████████████████████████████████████████████████████████████████ 100%

  State: complete
  Last Read Timestamp: 2023-02-02 18:42:55 +0000 UTC
Stopping
If you choose to manually stop a running import using opni import stop <cluter> <name> all operations on that import target will halt, but any data which has already been written to Opni's metrics store will not be removed.
Dealing with Prometheus Operator
If the cluster you want to install Opni onto has an existing Prometheus Operator instance installed (ex Rancher Monitoring), you will need to disable the agent's kube-prometheus-stack sub-chart with the following Helm values:
opni-agent:
  kube-prometheus-stack:
    enabled: false
Once Opni is installed, you'll need to follow these steps to ensure you have a Cortex deployment to import your metrics to using the steps listed above.
Validating Import
Now that you've imported data to your clusters you'll need to validate the import before you can safely tear down your existing metrics infrastructure. The simplest way to verify that your data has made it, is to use opni metrics admin query command.
You will want to specify the same labels and cluster used for the import. For example, if you imported data from cluster 0194fdc2-fa2f-4cc0-81d3-ff12045b73c8 with the label selector __name__=up you should run the command opni metrics admin query --clusters 0194fdc2-fa2f-4cc0-81d3-ff12045b73c8 '{__name__="up"}':
{
  "status": "success",
  "data": {
    "resultType": "vector",
    "result": [
      {
        "metric": {
          "__name__": "up",
          "__tenant_id__": "0194fdc2-fa2f-4cc0-81d3-ff12045b73c8",
          "container": "alertmanager",
          "endpoint": "http-web",
          "instance": "192.168.245.145:9093",
          "job": "rancher-monitoring-alertmanager",
          "namespace": "cattle-monitoring-system",
          "pod": "alertmanager-rancher-monitoring-alertmanager-0",
          "prometheus": "cattle-monitoring-system/rancher-monitoring-prometheus",
          "prometheus_replica": "prometheus-rancher-monitoring-prometheus-0",
          "service": "rancher-monitoring-alertmanager"
        },
        "value": [
          1678112707.697,
          "1"
        ]
      },

      // more data...
    ]
  }
}
If no metrics made it to the cluster, you will see output similar to: {"status":"success","data":{"resultType":"vector","result":[]}}.