Enable capabilities in downstream agents
By default, agents do not have any capabilities enabled. From the Opni dashboard or CLI, you can enable or disable capabilities per agent.
The following capabilities can be enabled in downstream agents:
- Metrics capability
- Logs capability
- Traces capability
Enabling the metrics capability for an agent will deploy a Prometheus instance on the agent's cluster. It will then automatically begin collecting metrics and sending them to the Opni Gateway, where they will be forwarded to Cortex.
Prerequisites
Before you can enable the metrics capability for agents, you must first enable the Monitoring backend in the Opni cluster. See Enable Backends for instructions.
If the backend is not installed, you will see the following tooltip when hovering over the Monitoring capability button:
Using the Opni dashboard
To enable the metrics capability for an agent using the Opni dashboard, follow these steps:
Navigate to the Opni dashboard.
To access the dashboard, you can port-forward:
kubectl -n opni port-forward svc/opni-admin-dashboard web:webThen navigate to http://localhost:12080.
Select "Clusters" from the left sidebar, and identify the cluster you want to enable the metrics capability for. Click the capability button to enable it.


If the installation succeeds, you should see data in the the Distinct Metrics and Metrics Ingestion Rate fields for this cluster.
 Cluster Names
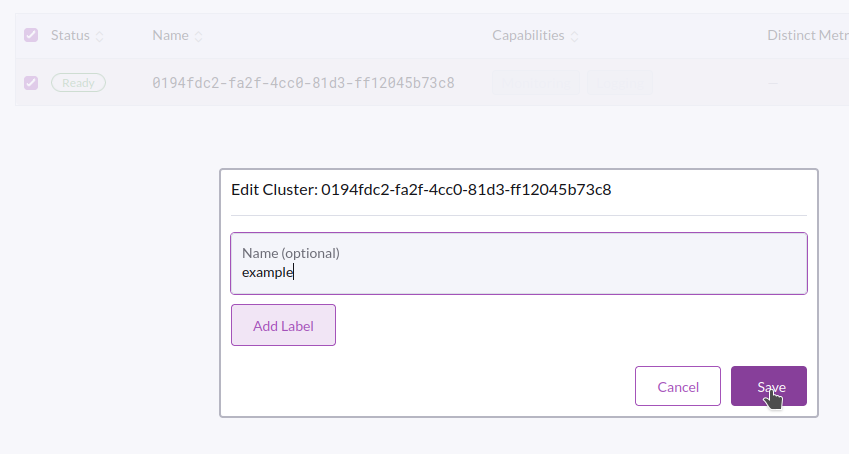
Clusters are identified by a UUID by default, but you can set a name alias for the cluster to make it easier to identify. To edit a cluster's name, right-click on it and choose "Edit", then input a name and click "Save".

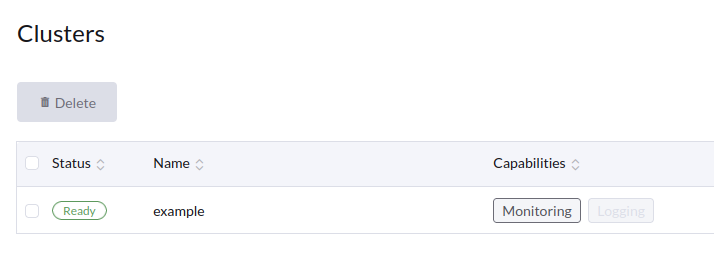
Afterwards, the cluster will be listed by its name instead of its UUID.

If you need the UUID later, you can right-click on the cluster and select "Copy ID".
Identifying a cluster by UUIDThe UUID used to identify a cluster is the
uidof the cluster'skube-systemnamespace resource. If needed, you can obtain a cluster's UUID manually with the following command:kubectl get namespace kube-system -o jsonpath='{.metadata.uid}'
Using the CLI
You can also manage cluster capabilities using the Opni CLI.
The opni capability command can install, uninstall, and check the status of cluster capabilities. See below for an example of how these commands can be used:
$ opni capabilities status metrics 4003b8a2-333e-4f3a-889b-7993700b9d25
Not installed
$ opni capabilities install metrics 4003b8a2-333e-4f3a-889b-7993700b9d25
2022-10-20T16:30:26.515Z INFO commands/capabilities.go:81 Capability installed successfully
$ opni capabilities status metrics 4003b8a2-333e-4f3a-889b-7993700b9d25
Installed
$ opni capabilities uninstall metrics 4003b8a2-333e-4f3a-889b-7993700b9d25
2022-10-20T16:30:38.667Z INFO commands/capabilities.go:118 Uninstall request submitted successfully
2022-10-20T16:30:38.667Z INFO commands/capabilities.go:124 Watching for progress updates...
INFO [Oct 20 16:30:38.663] State changed to Pending
INFO [Oct 20 16:30:38.669] Stored data will not be deleted
INFO [Oct 20 16:30:38.672] State changed to Running
INFO [Oct 20 16:30:38.680] Uninstalling metrics capability for this cluster
INFO [Oct 20 16:30:38.682] Time series data will not be deleted
INFO [Oct 20 16:30:38.686] Removing capability from cluster metadata
INFO [Oct 20 16:30:38.691] State changed to Completed
INFO [Oct 20 16:30:38.698] Capability uninstalled successfully
$ opni capabilities status metrics 4003b8a2-333e-4f3a-889b-7993700b9d25
Not installed
Prerequisites:
- Opni logging backend is enabled in upstream Opni
To install the Logs capability into a cluster once the logging backend is installed, select the Logging button in the clusters screen

The Opni agent will detect the type of cluster it is installed into and create an appropriate fluentbit and fluentd configuration to collect the logs. It will also start collecting Kubernetes events from inside the cluster. These will all be sent to the Opni Shipper deployment which is configured to authenticate to Opensearch in the central cluster and ship logs to the endpoint.
Prerequisites
In the cluster you'd like to get traces from
- Logs Capability is enabled
- Applications have been instrumented with OpenTelemetry
Config OpenTelemetry Collector
Opni agent installs a data shipper when the logs capability is enabled in a connected cluster.
You must export traces from OpenTelemetry collector to Opni agent's data shipper at port 21890. This guild shows an example of how to do so.