Enable Opni AIOps
Logging backend must be enabled before enabling AIOps
Opni AIOps currently features log anomaly detection - it provides log insights by distinguishing normal and anomalous logs. Log anomaly detection comes in two flavors:
Pre-trained models
- Models trained by SUSE Rancher that specialize on K8s control plane, Rancher, and Longhorn logs
- Do not require a GPU
Auto generated models for user selected workloads
- User selects 1 or more workload deployments important to them
- Opni will self train a model and provide insights for logs belonging to user selected workloads
- NVIDIA GPU is required to run
Learn more about the two flavors below.
- Pretrained models
- Auto generated models for user selected workloads
Opni log anomaly detection comes with three specialized pretrained Deep Learning models which are maintained by SUSE Rancher. These models have been optimized to not require a GPU for usage, provide state-of-the-art accuracy and each one has a size just under 80 MB. Use these models to accelerate mean time to resolution.
Prerequisites
The Opni cluster must have Opni logging enabled.
Kubernetes control plane and etcd logs
- Compatible with control plane and etcd logs from RKE1, RKE2 and K3s distributions.
- Identifies granular anomalies within specific Kubernetes components.
Rancher logs
- Compatible with any distribution of Kubernetes that is running any distribution of Rancher.
Longhorn logs
- Compatible with any distribution of Kubernetes that is running any distribution of Longhorn.
- self-train models that learn from logs of the workloads user have selected
- Doesn't require high volume of data to get started
- No AI/ML knowledge needed
Note that it requires an GPU available in the Opni cluster.
Prerequisites
- Opni logging enabled
- Enabling AIOps and the GPU Services
- At least 1 NVIDIA GPU attached
Getting Started
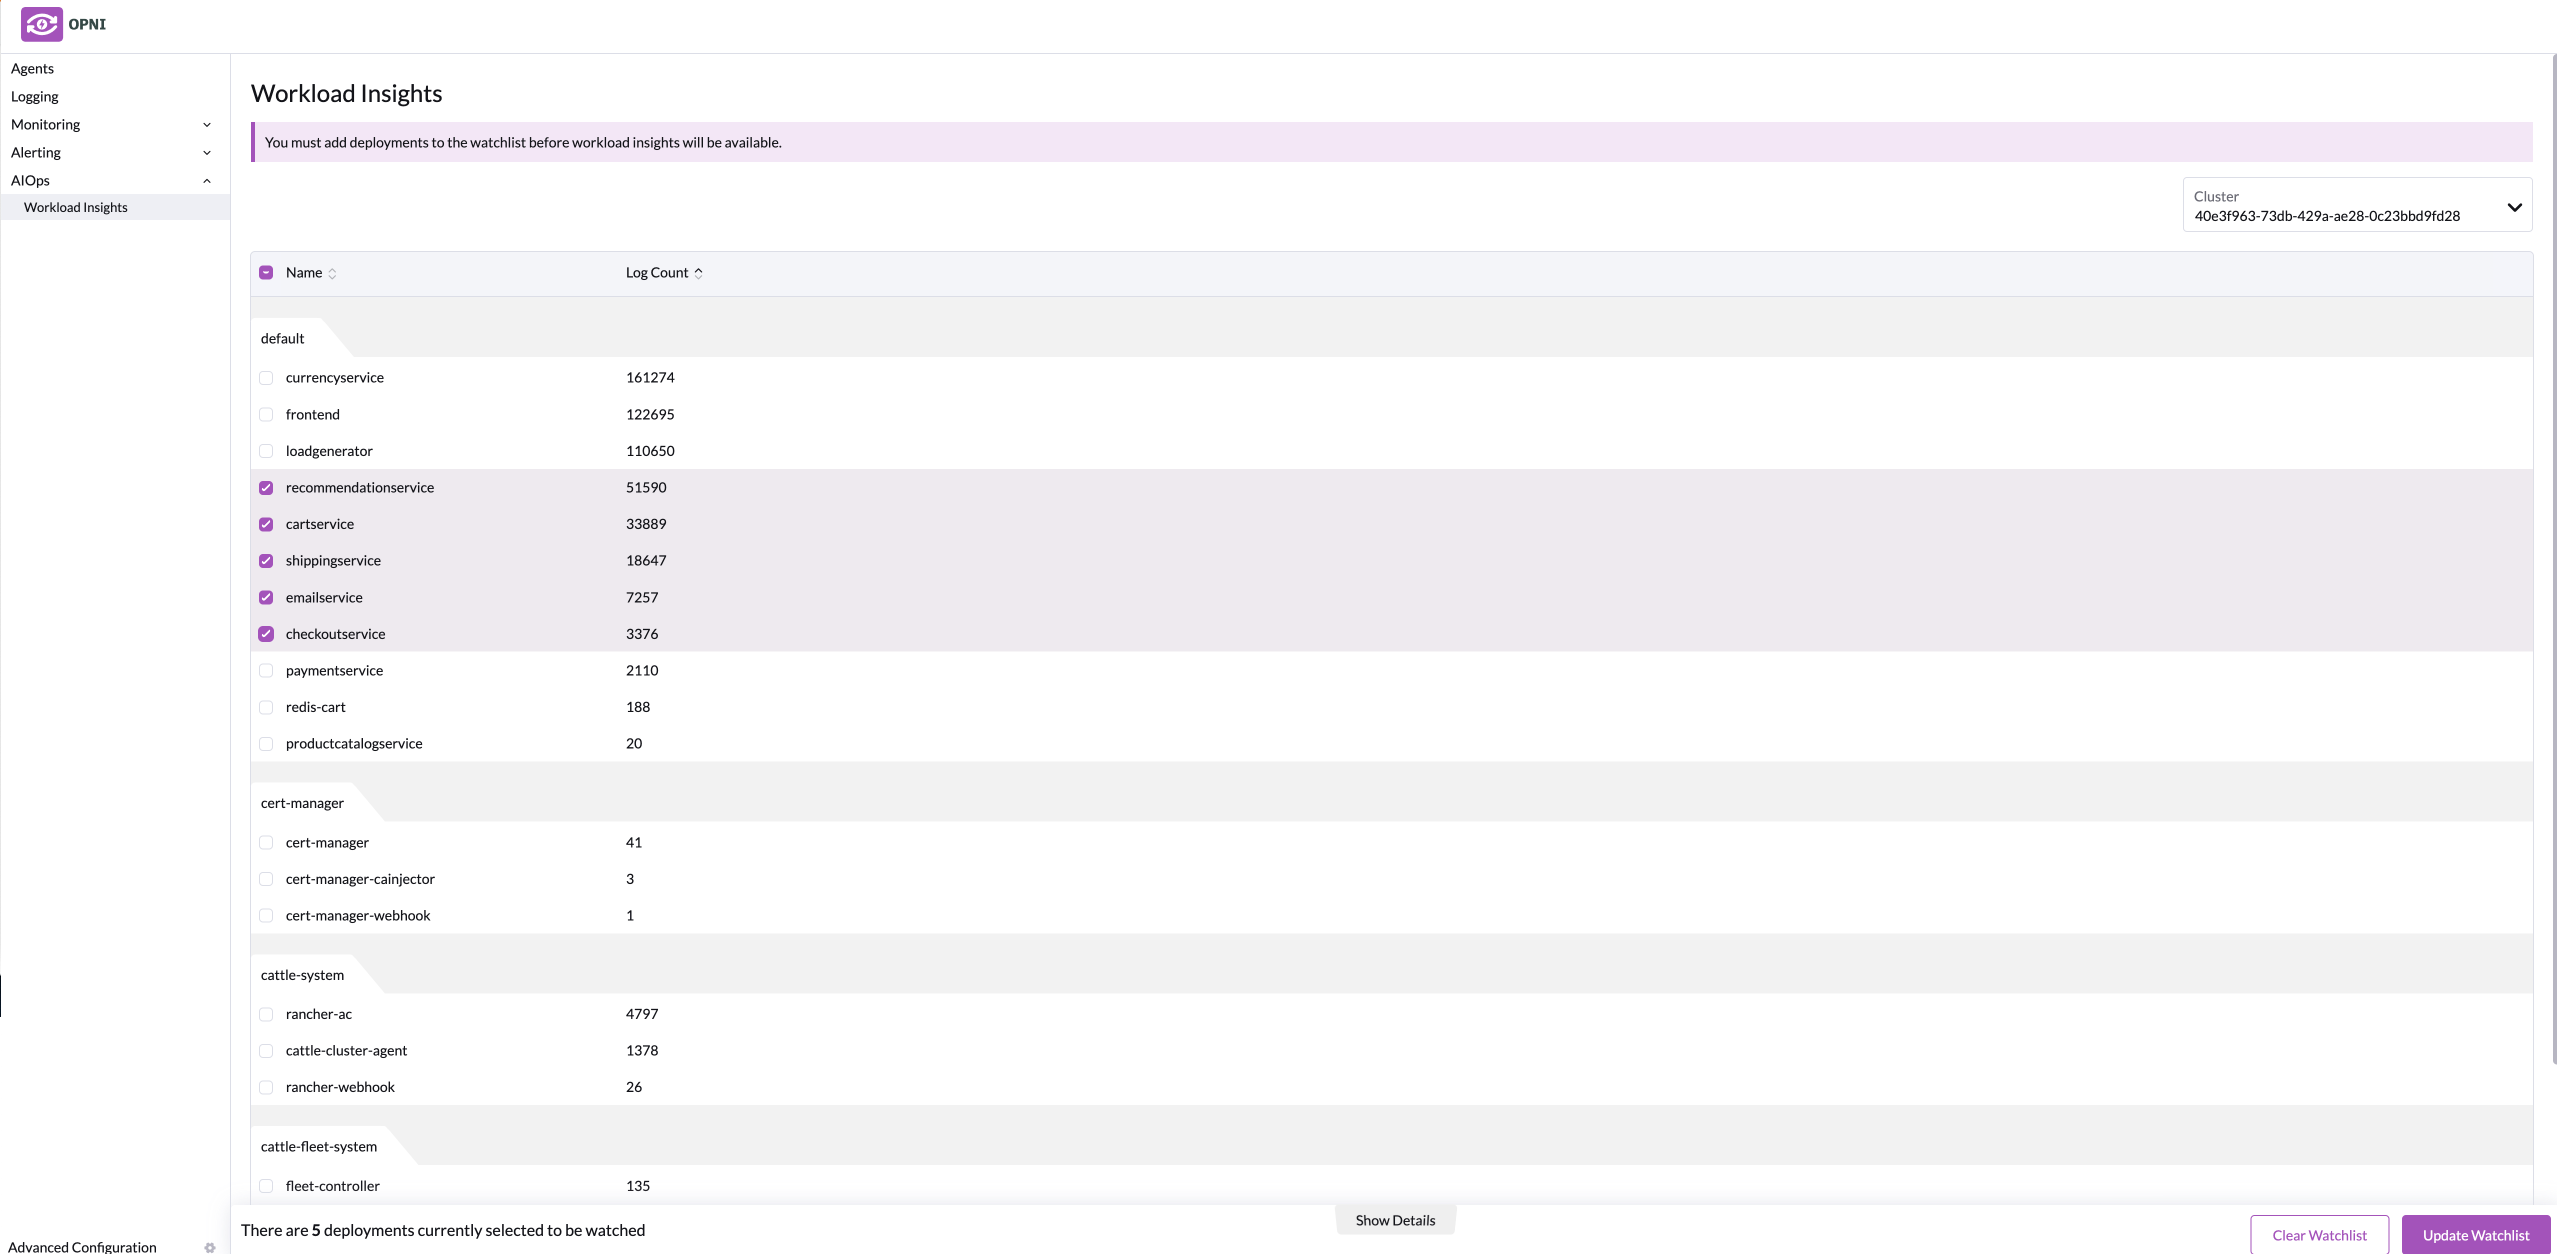
- Within the Opni Admin Dashboard, once AIOps has been enabled, go to the Workload Insights Tab.
- Select a cluster
- Select the workloads you want
- Click Update Watchlist to submit the configuration
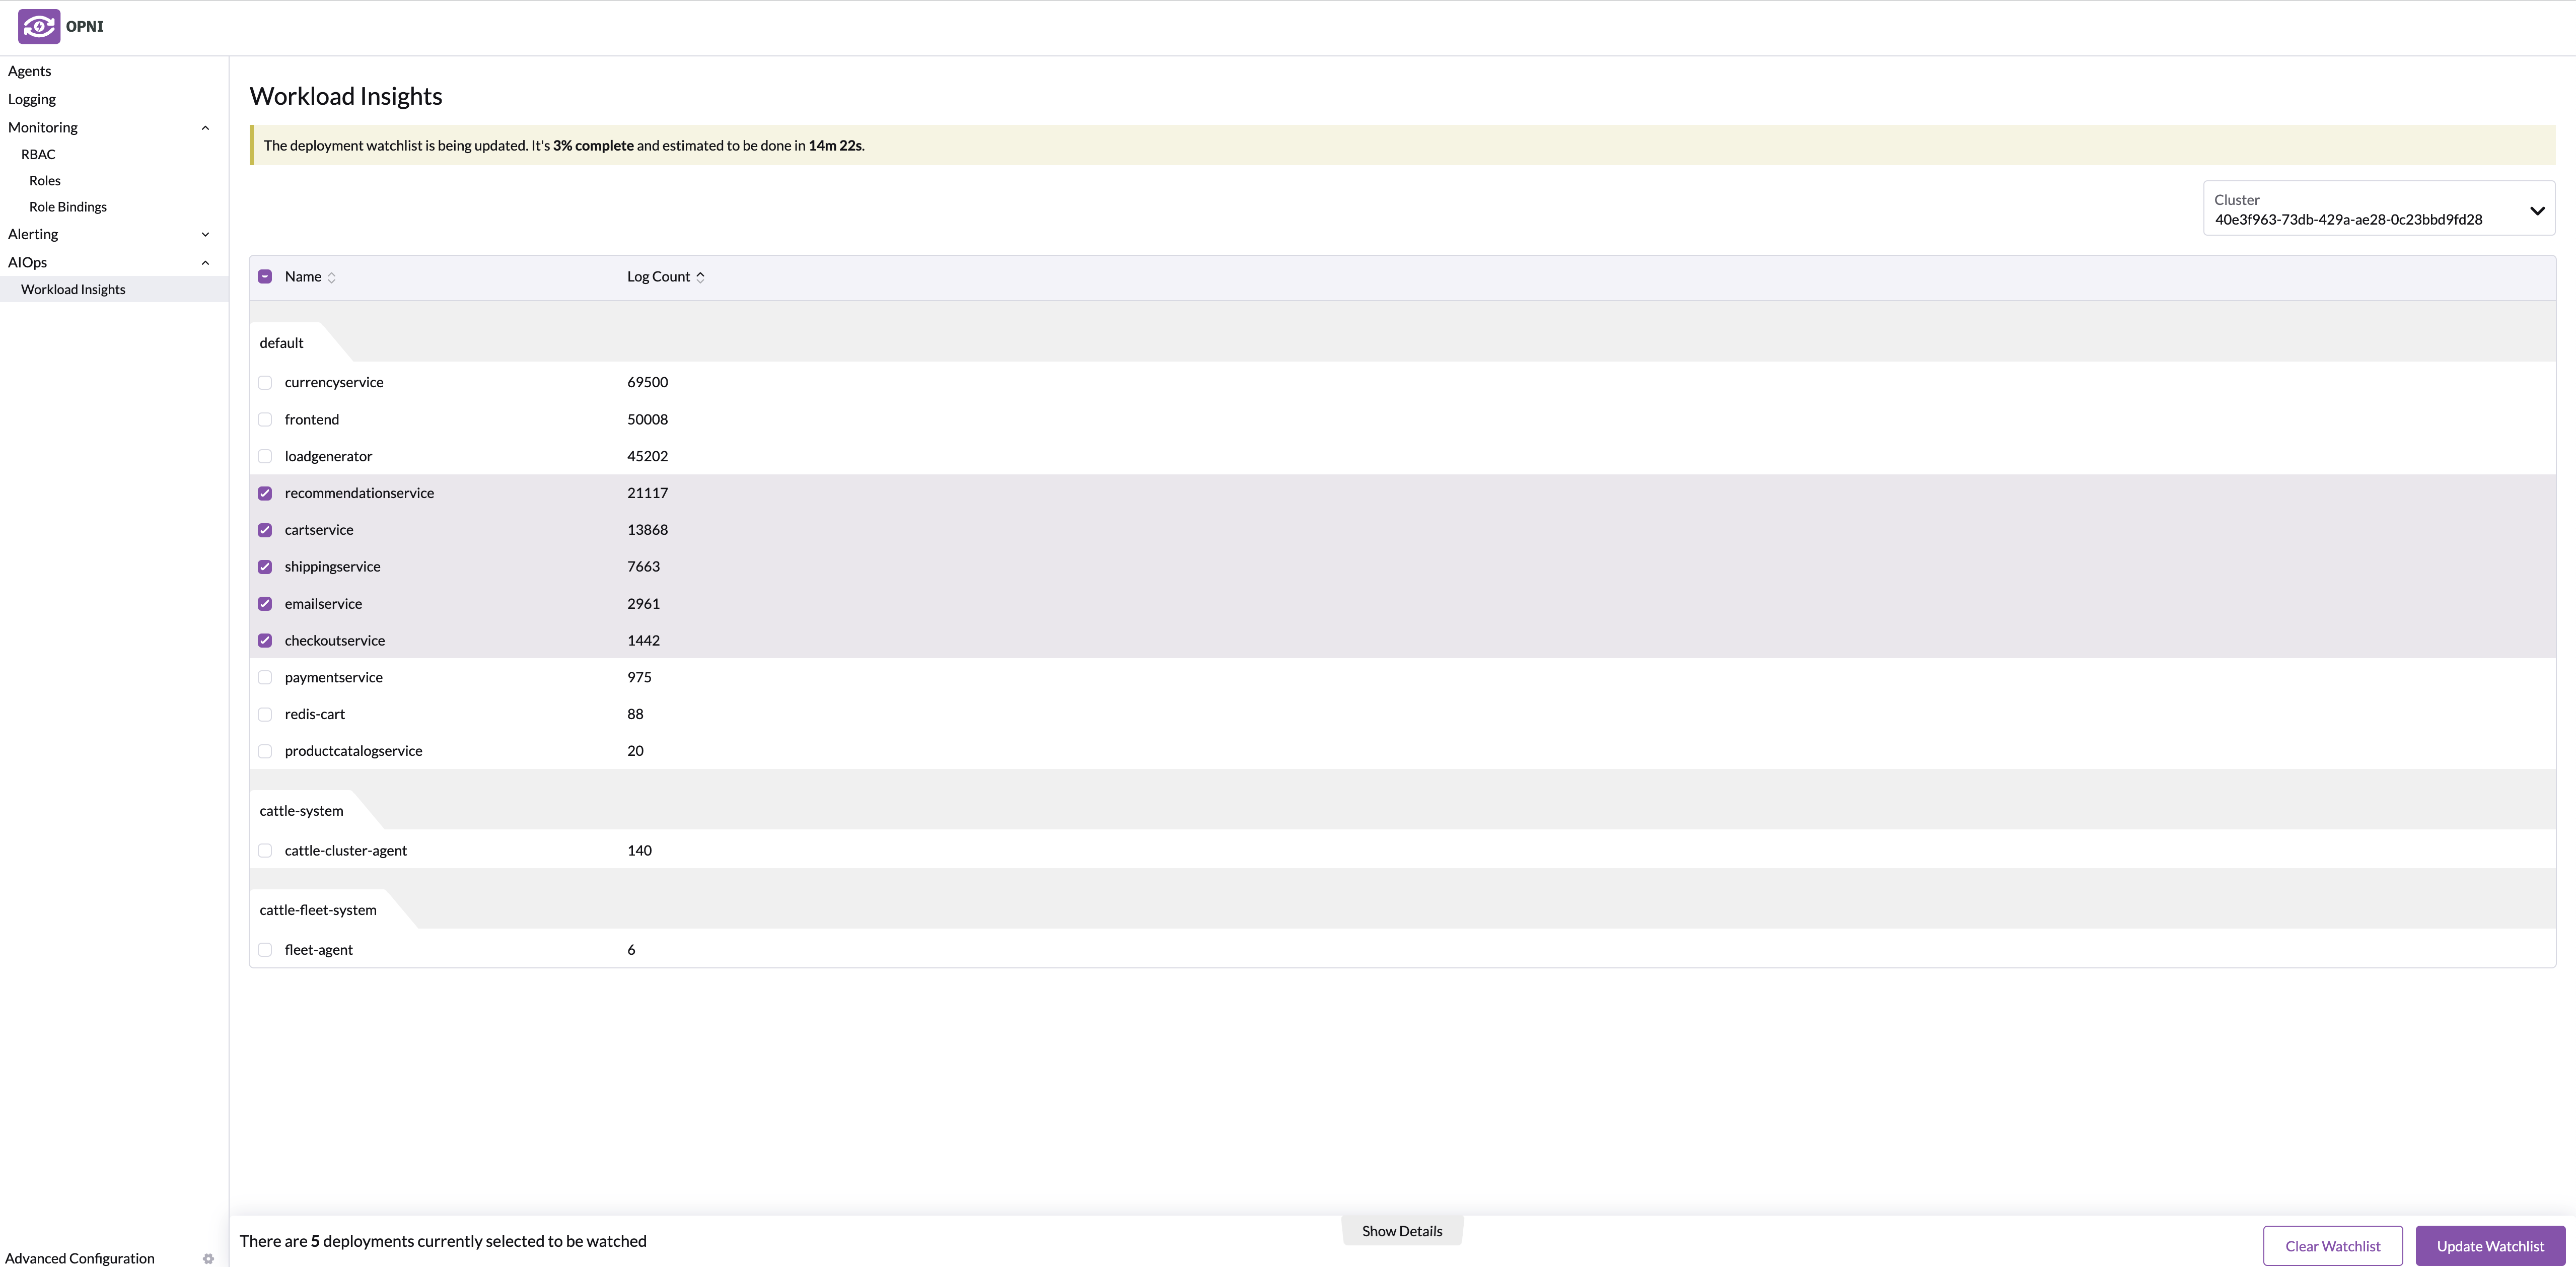
The UI will give a status of the progress of the model.
Once the model is ready, you can then navigate to Opni's Opensearch dashboard and consume AI Insights.
Remove workloads
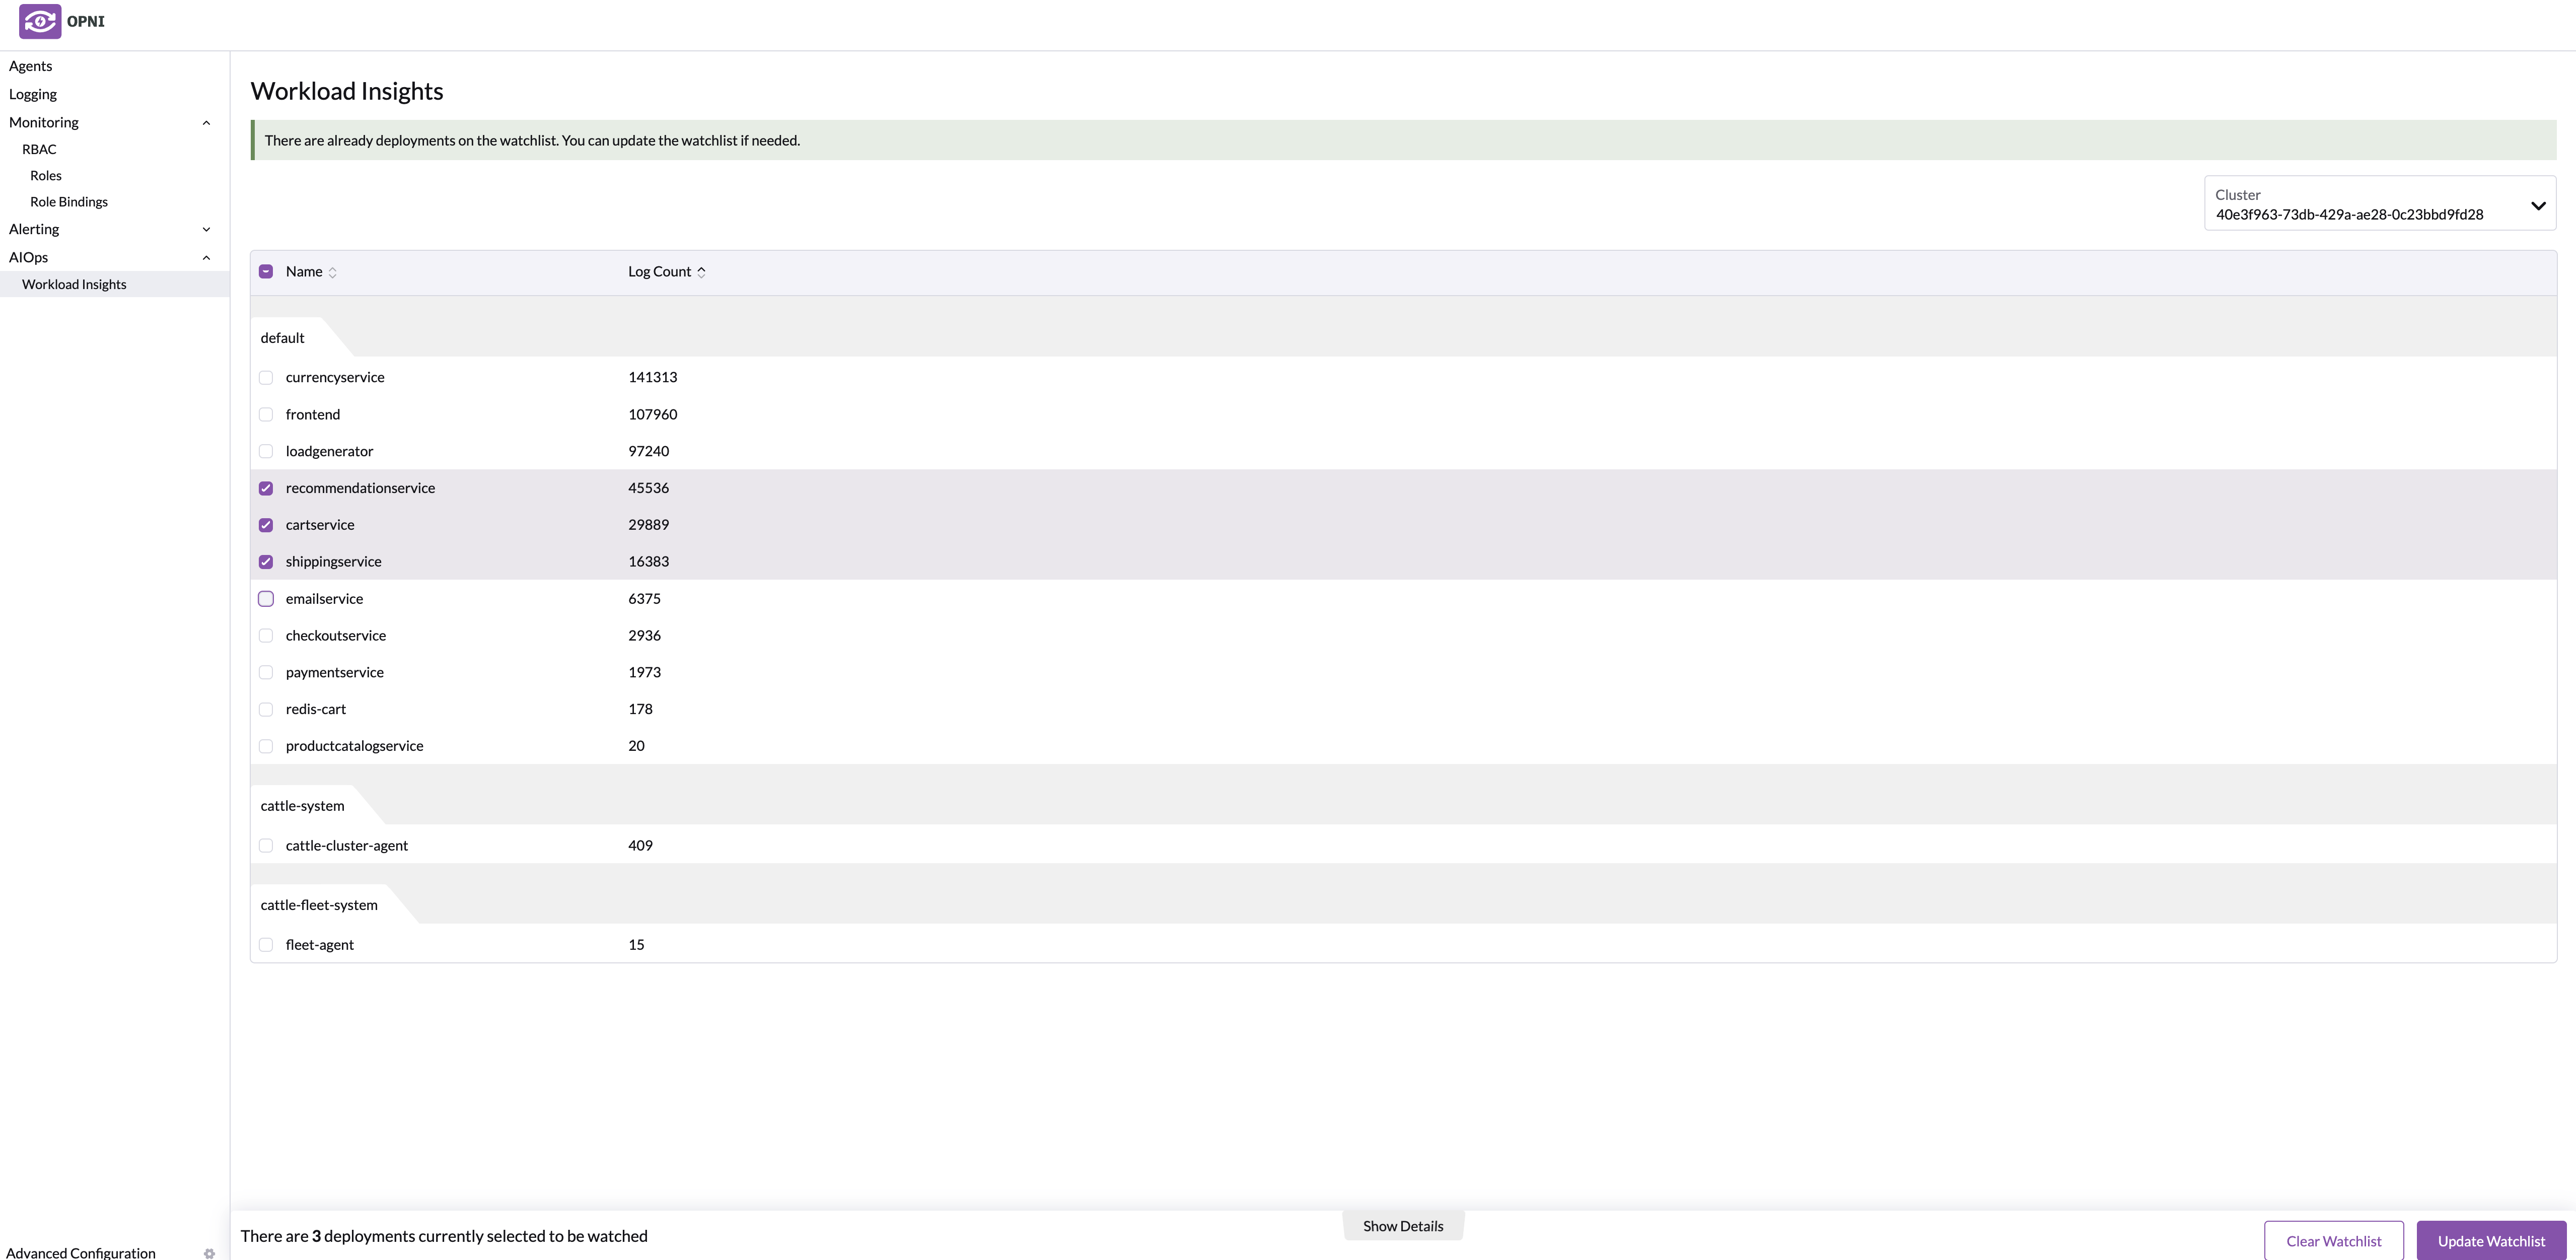
To remove the workloads you don't want anymore, simply uncheck the boxes and Update Watchlist.
Reset workloads
To reset your watchlist, simply hit the button Clear Watchlist.
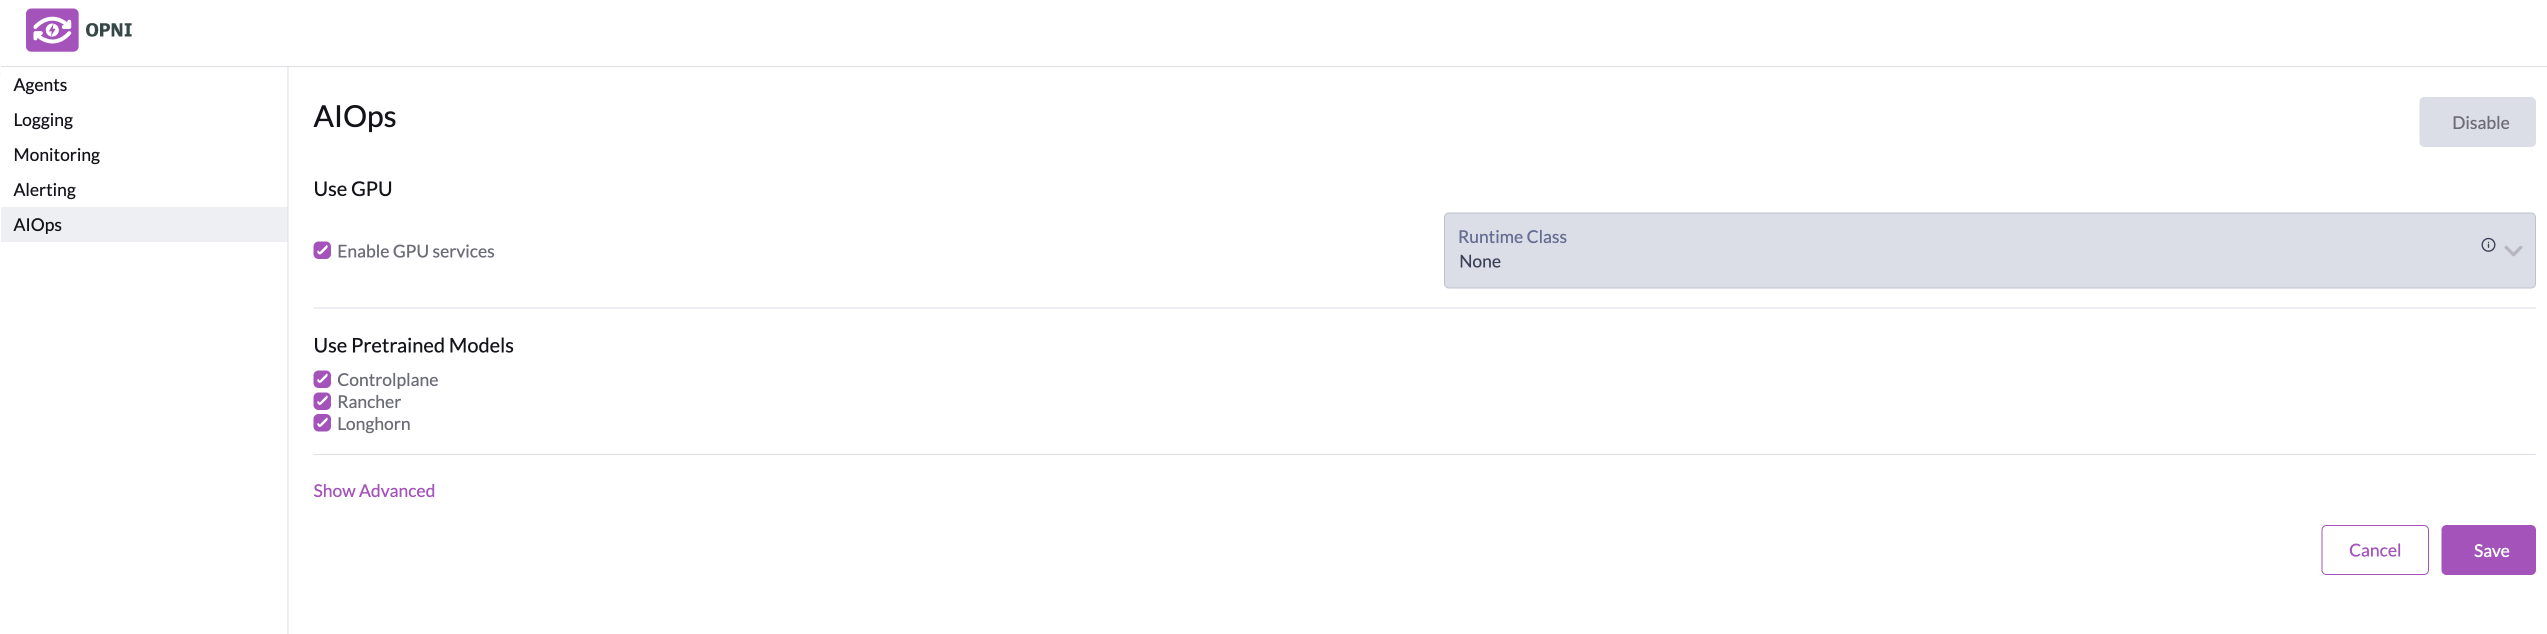
Enabling AI Services
Setting up log anomaly detection for Opni can be done through the Opni admin dashboard. Go to the AIOps section and then check the pretrained models that the user would like to receive insights from. If a GPU is enabled on this cluster and the user would like to receive insights on selected workloads, check the Enable GPU services button.
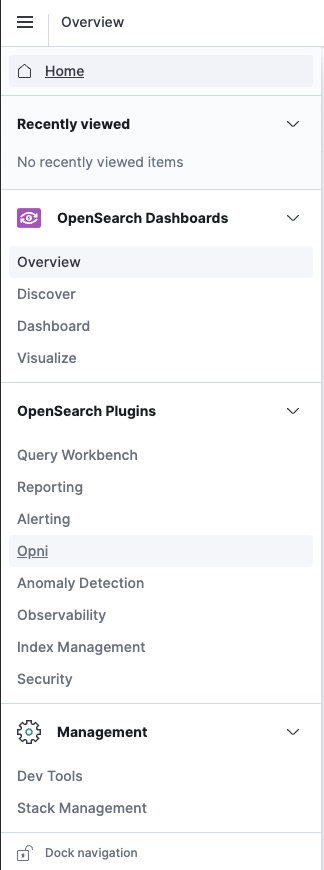
Consuming AI Insights from Opni
Once Opni logging has been enabled in the central cluster, log anomaly insights can now be obtained by going to Opensearch Dashboards and viewing the Opni plugin.
Overall Insights
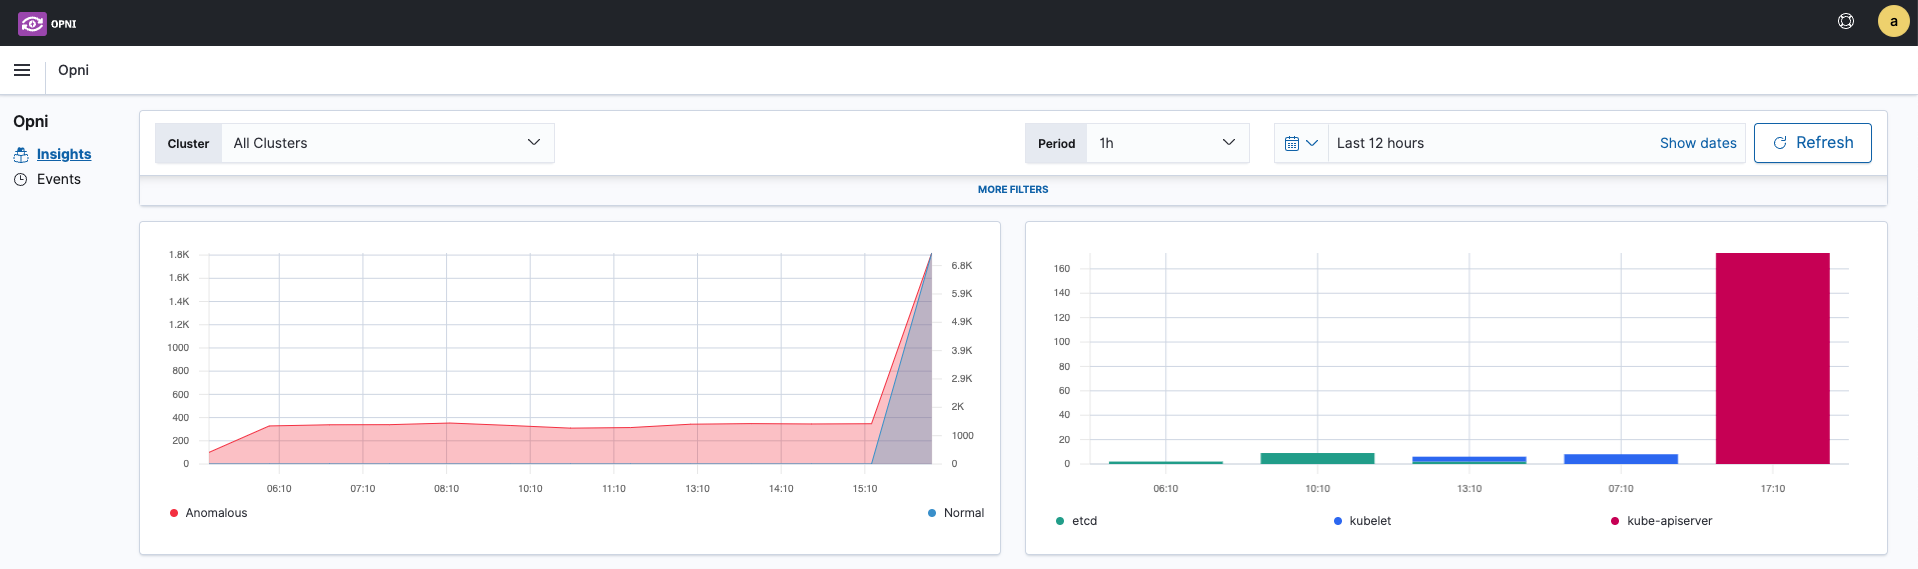
The Opni UI within Opensearch breaks down the status of all clusters into an easy-to-consume manner. From the top two panels, the left chart shows the overall number of normal and anomalous logs in the system and the right chart shows the breakdown of anomalous log messages from Kubernetes control plane components.
Workload Log Insights
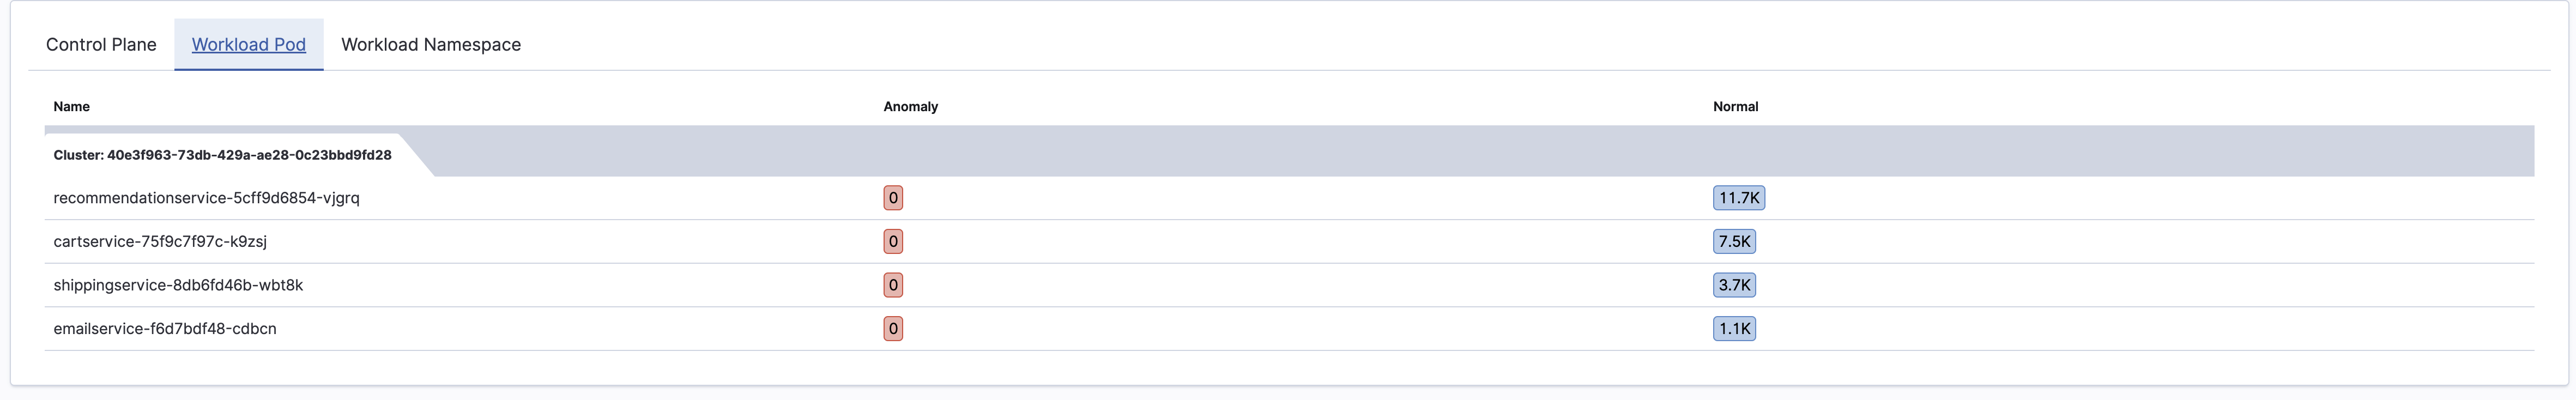
For workload logs, the Opni UI will display the breakdown of normal and anomalous log messages at a pod level among the selected deployments.
Kubernetes Control Plane and Etcd Log Insights
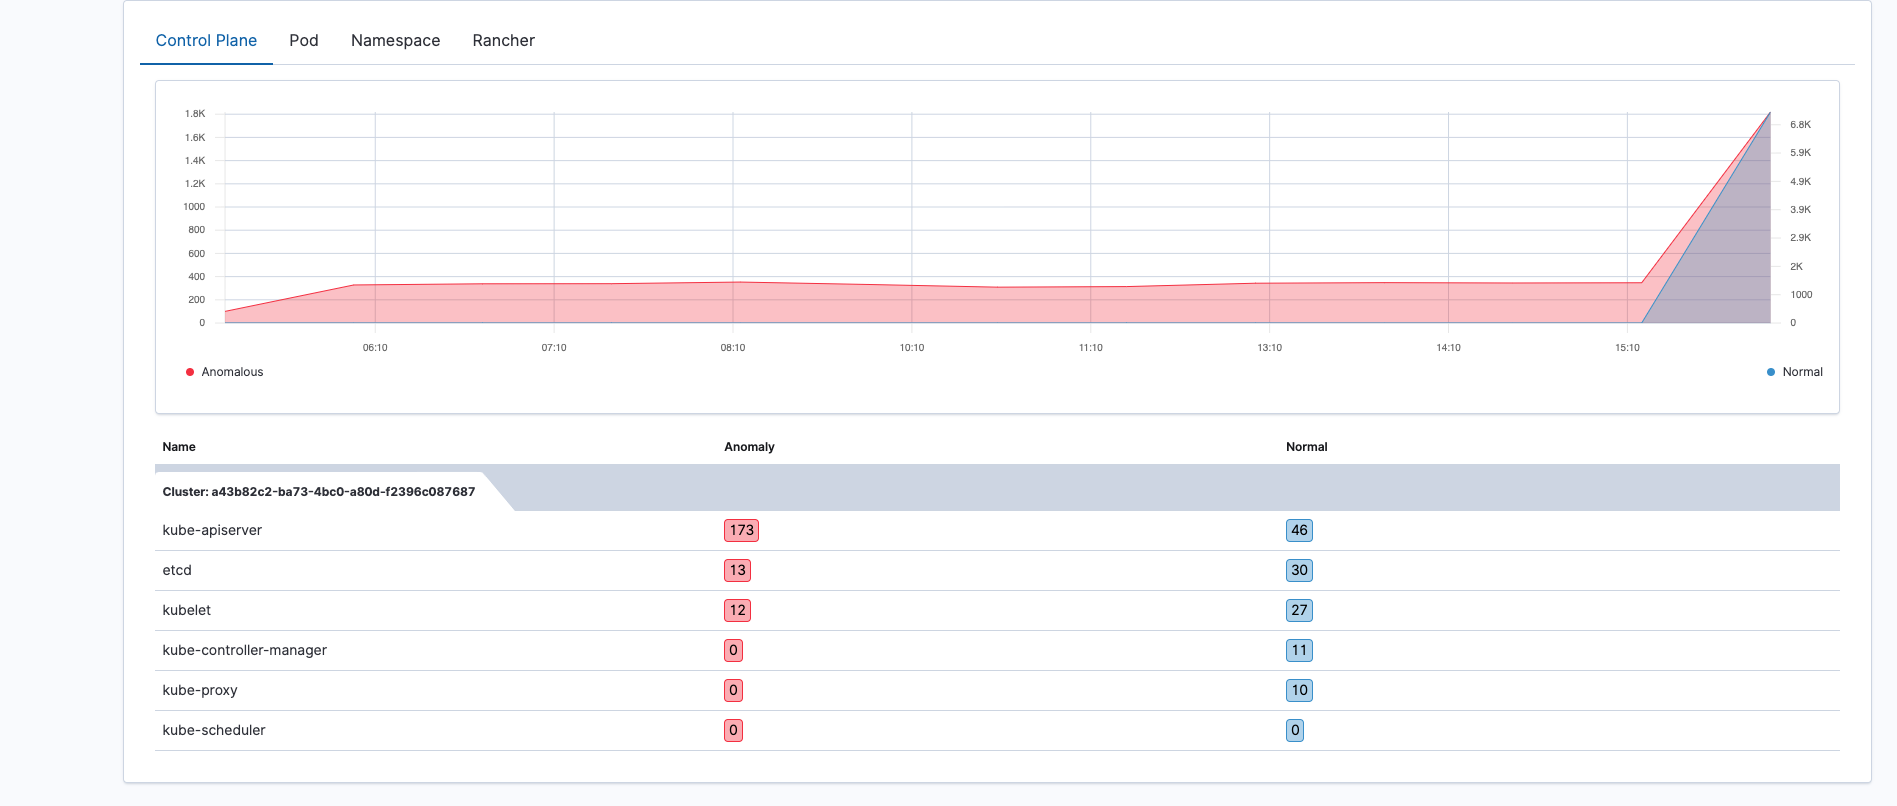
For control plane logs, the Opni UI allows the user to zone in on specific Kubernetes components and upon clicking on the number of anomalous or normal log messages, the user will be redirected to the actual log messages that were inferred on by the pretrained Deep Learning model for control plane logs.
Rancher Log Insights
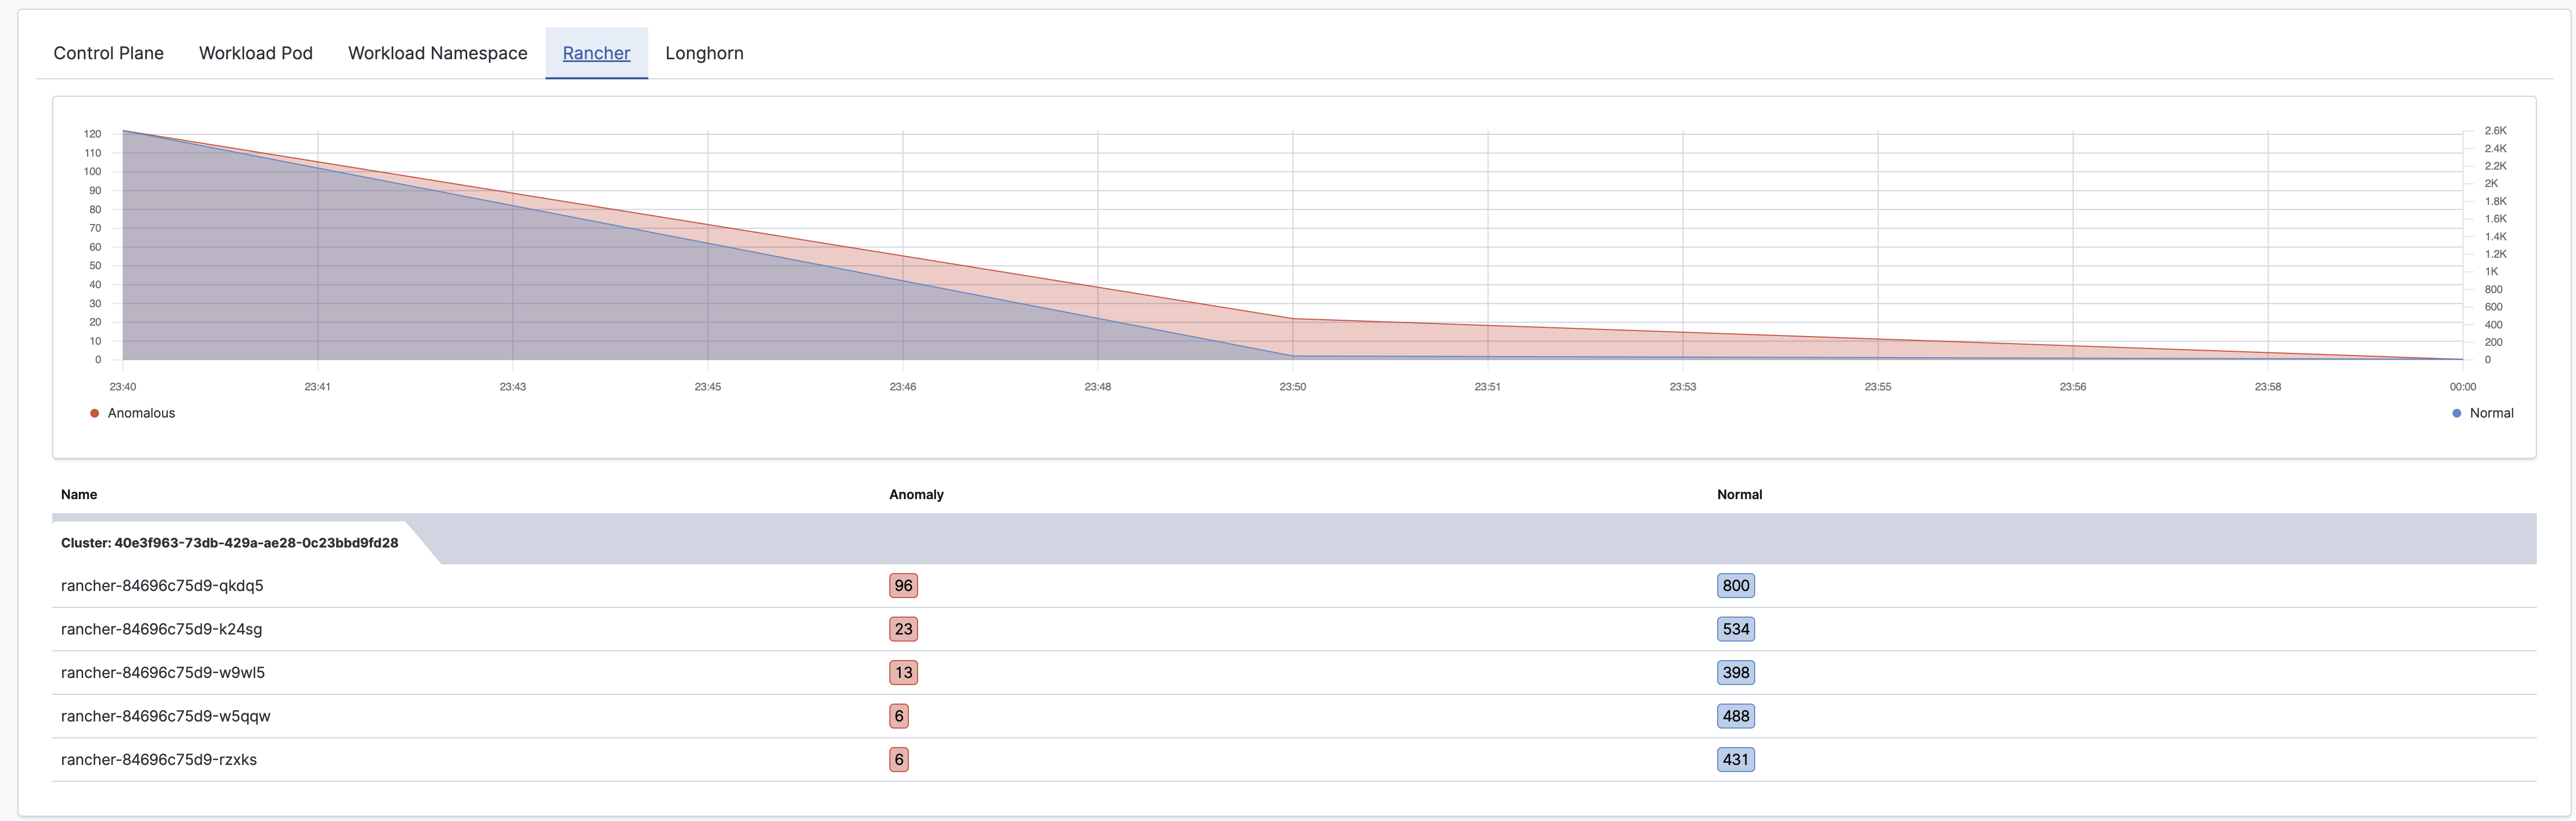
Similar to the control plane logs, Rancher logs are also displayed in an easy-to-consume manner where the user can be redirected to the Dashboards page to view the actual log messages that were inferred by the pretrained deep learning model for Rancher logs.
Longhorn Log Insights
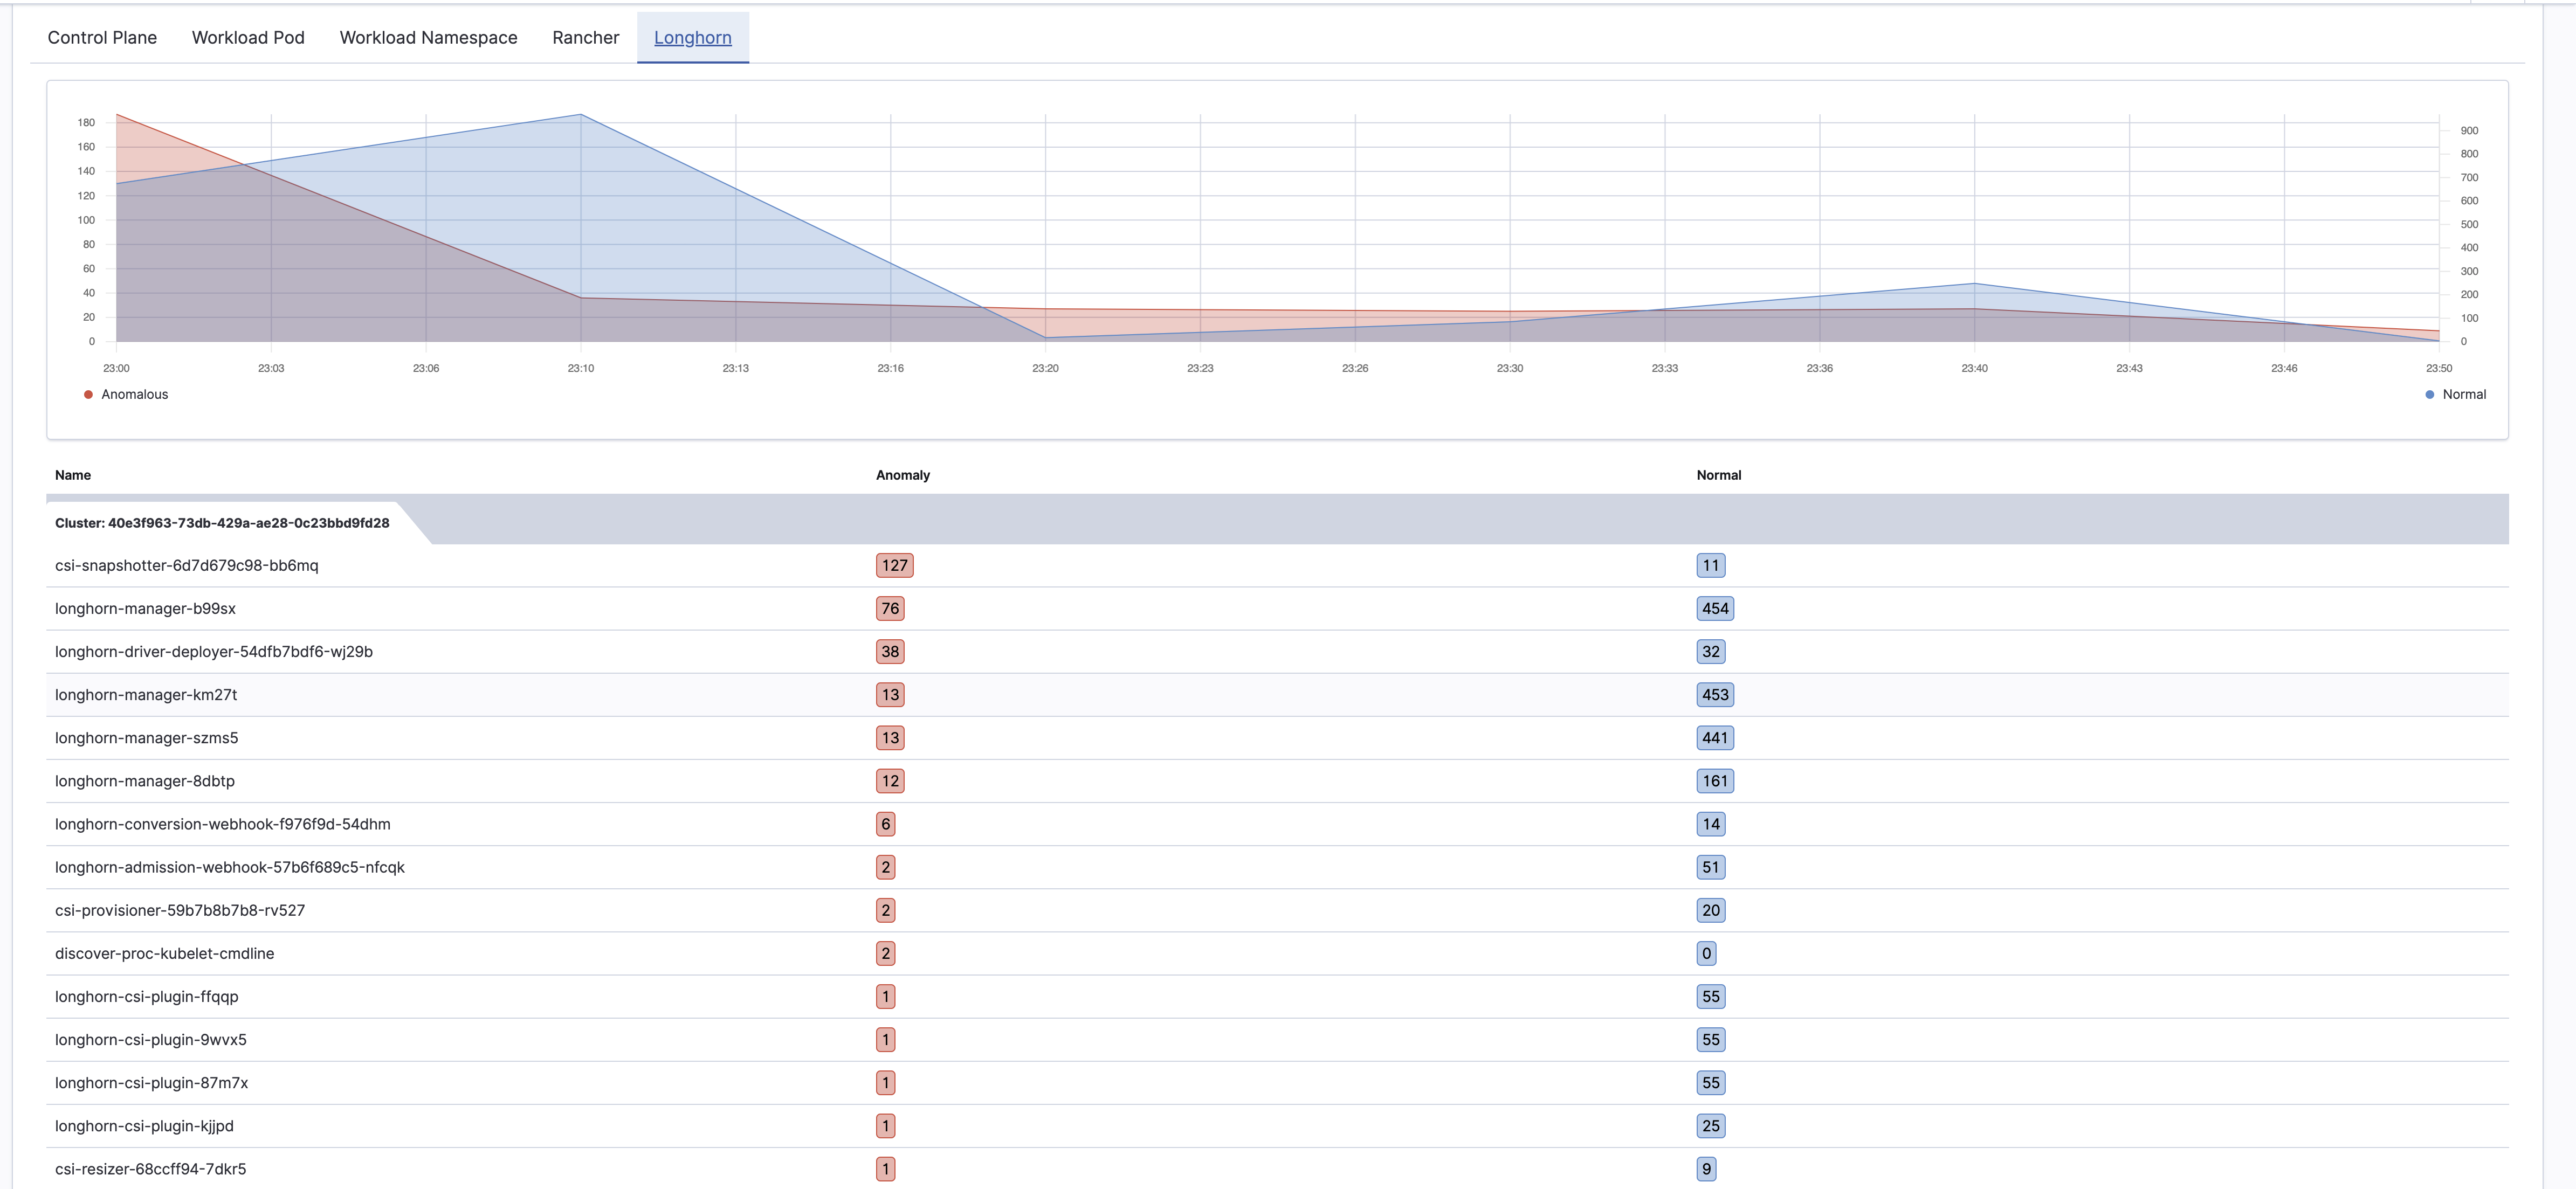 Longhorn logs are displayed in an easy-to-consume manner where the user can be redirected to the Dashboards page to view the actual log messages that were inferred by the pretrained deep learning model for Longhorn logs