Enable SLOs
Introduction
The term SLO, or Service Level Objective, is derived from the need in production applications for SLAs, or Service Level Agreements.
SLAs specify a target for application performance, reliability or health, and SLOs are the tool used to observe and measure said application's performance, reliability or health.
SLOs can be broken down into two components :
- SLI: the actual metrics that represent the application performance, reliability or health over some period of time
- Target: an objective we want the metrics the SLI defines to abide by
Observability of SLOs
There are many ways to define and observe SLOs, in Opni we choose to represent them as :
which lets consumers of Opni SLOs specify the good events and total events they consider relevant to their applications.
For example, should an operator want to observe the reliability of an application's http requests, an operator may choose to classify the events as:
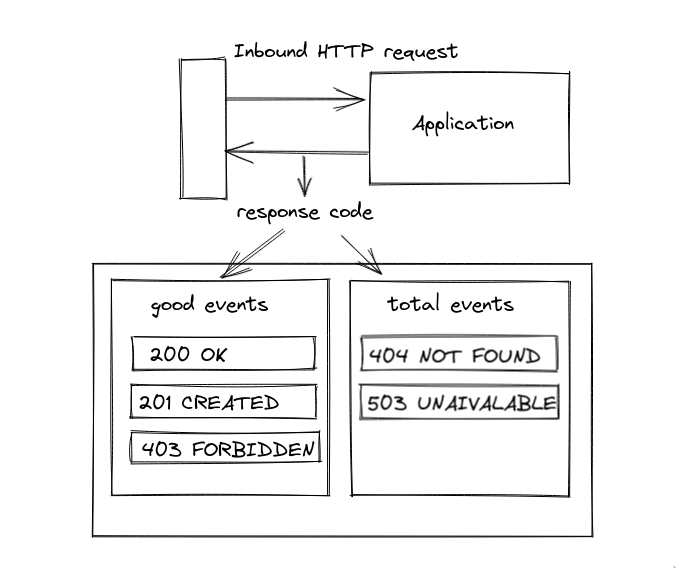
- Leaving the total of events empty includes all events observed
- All good events are automatically included in the list of total events
- If total events is not-empty, codes that are neither classified as total or good will be ignored from the calculation
Opni SLOs create several metrics to help understand the observed performance, reliability and health of your SLO:
- Error Budget: Metric representing the remaining number of bad events until the SLO's target is breached
- Burn Rate: The current rate at which bad events are occuring
- Expected Budget Consumption: Metric that predicts the budget consumption over the SLO's period based on a variety of factors
Getting Started
Opni's SLO functionality requires :
- The Opni Monitoring Backend
- One or more agents with the metrics capability enabled
Create Opni SLO
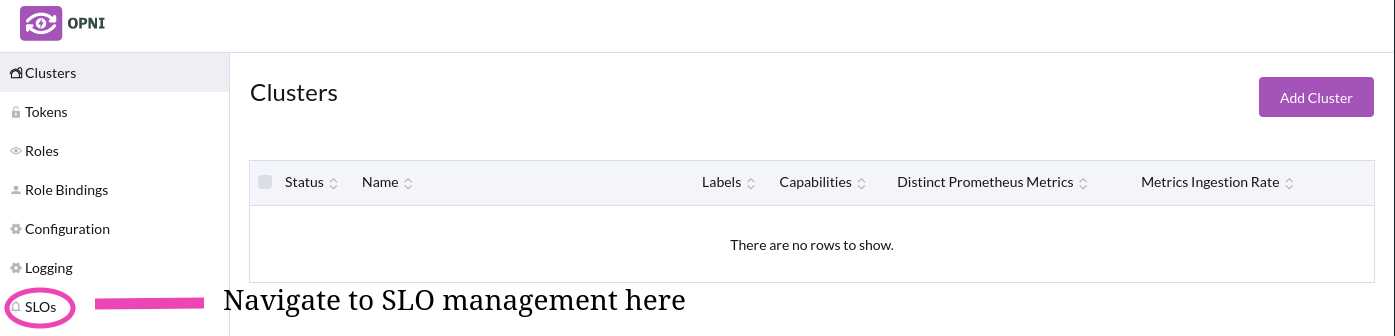
Navigate to your Opni Admin Dashboard:
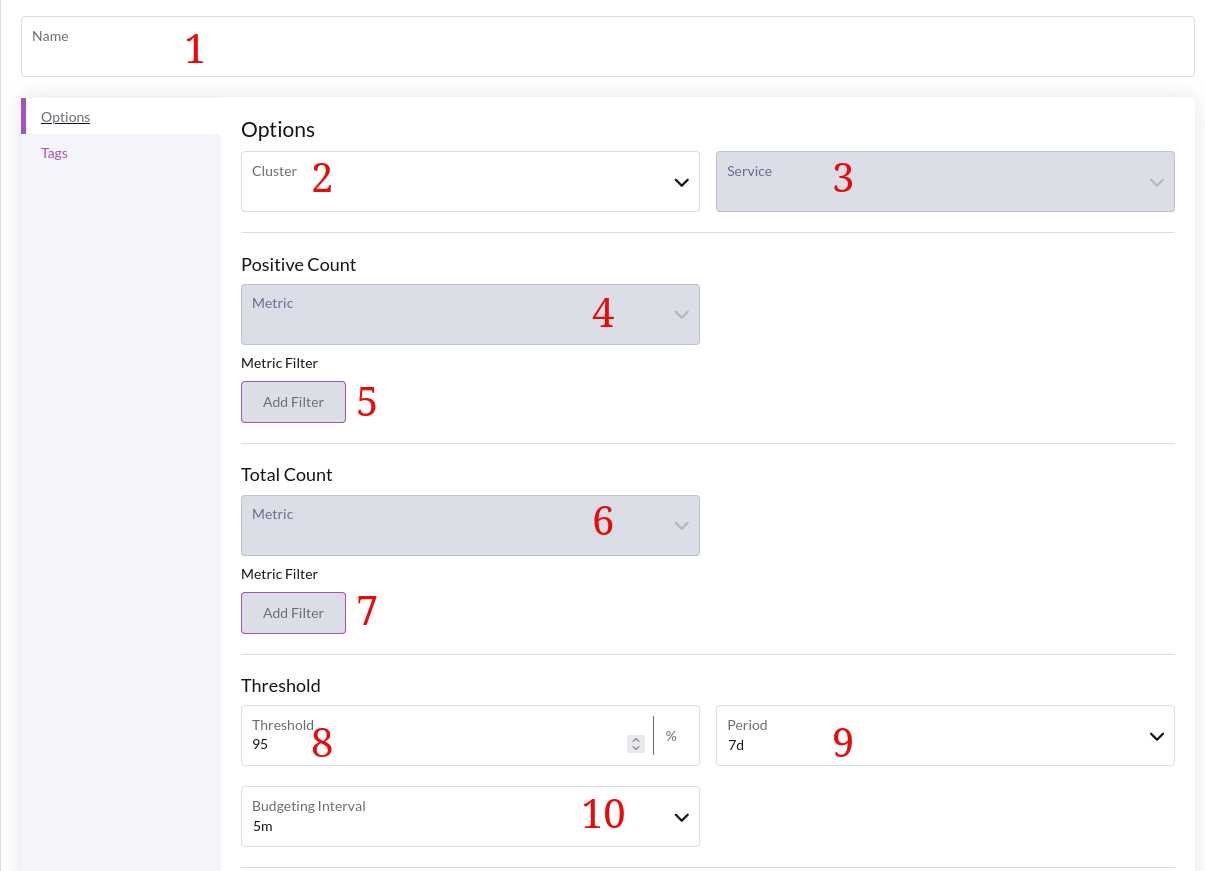
Select a name for your new SLO.
Select the cluster you wish to observe.
Select a service discovered by the metrics backend.
Select a metric exposed by your system that you want to monitor with an SLO.
The Metric filter allows you to tell Opni what the good events are for your SLO.
You must select at least one filter for your positive count, otherwise your SLI will be trivial (same events compared to same events)
- Select a metric that represents the total count of events in your system to monitor
The total count metric should always match your good count metric, unless you are confident in what you are doing (the SLI is no longer guaranteed to be within 0 - 1, depending on the total metric you choose)
Selecting a different total metric should be done when analyzing quantiles, for example metric_name_bucket_total / metric_name_count_total.
Define any filter on the total events, if any. The default is to consider all events as part of the total events.
The target for the SLO to achieve over the period.
The period upon which the target should apply.
How closely the SLO should track changes in the burn rate. A lower budgeting interval means deviations in burn rate will be alerted on more frequently.
Example Usecase
When the Kubernetes apiserver is not available, this can be an indicator of underlying cluster performance issues, for example CPU, memory, FS or disk usage saturation.
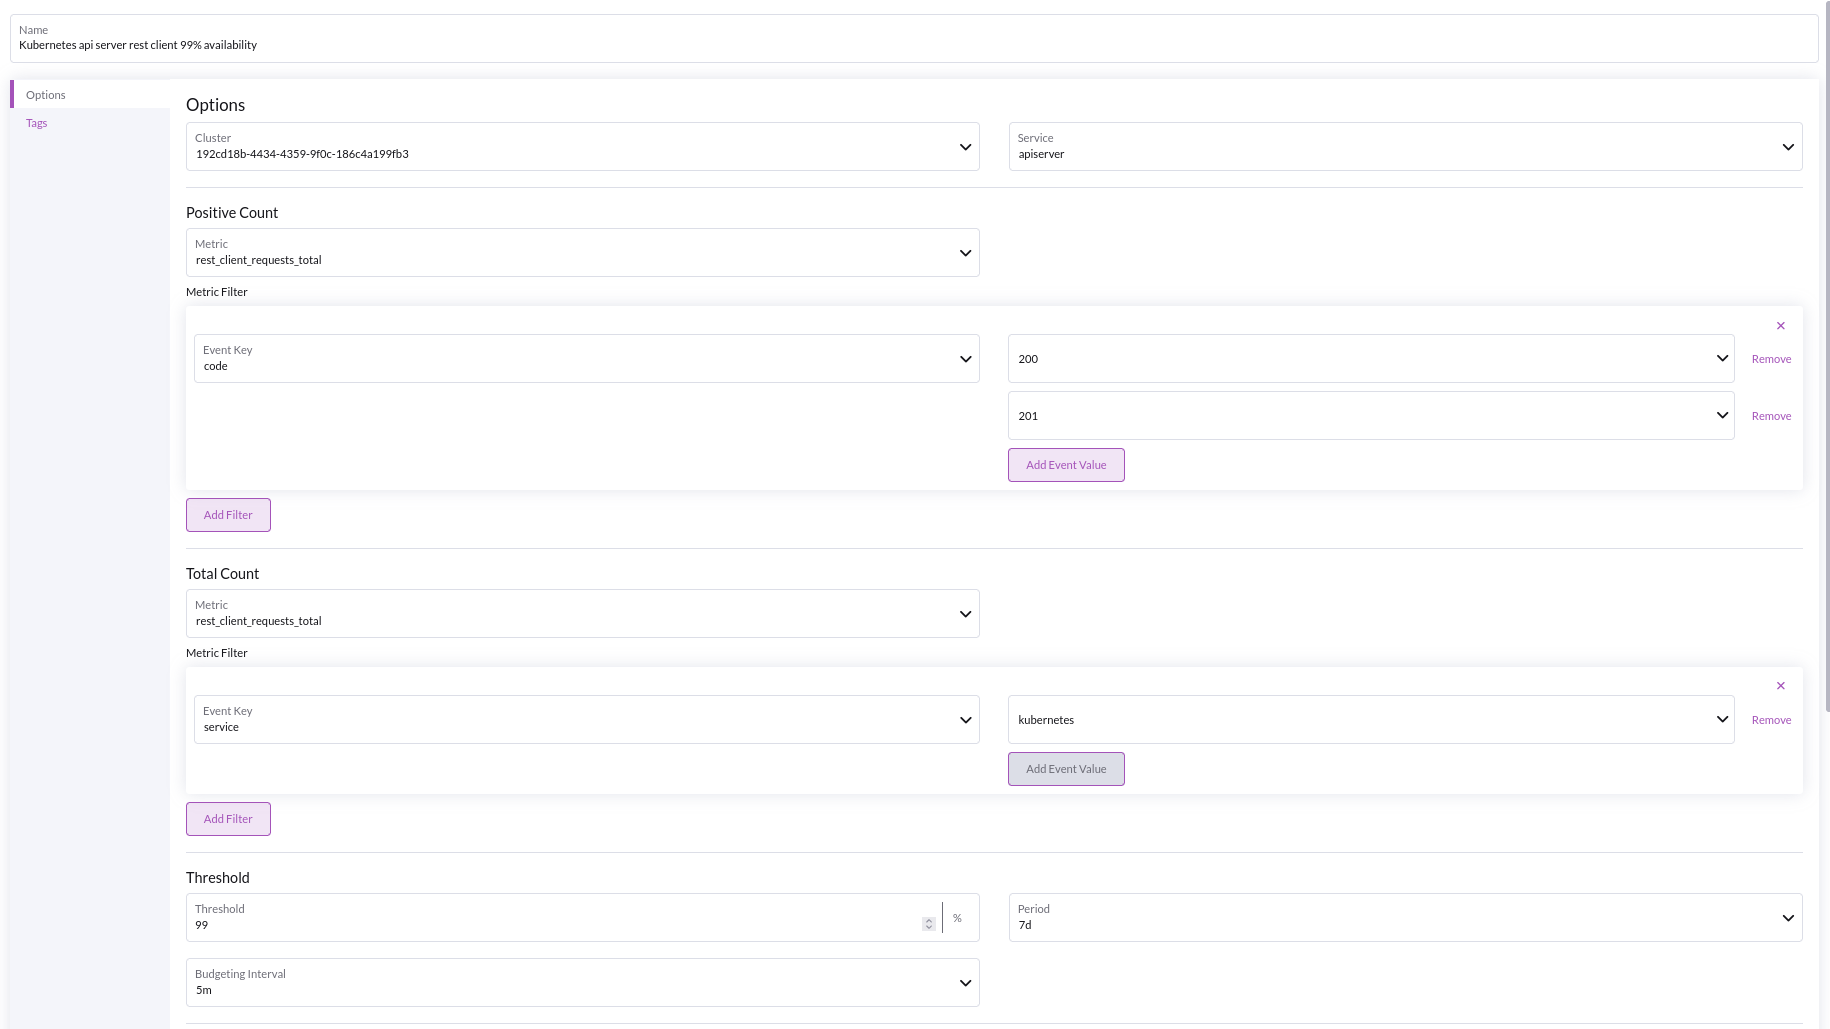
The example pictured below details an SLO that measures the HTTP-availability of the Kubernetes api server:
- The filter on response codes of 200/201 from the apiserver indicates GET/LIST/CREATE/DELETE requests are working, while others may indicate that the api server is busy or encountering other issues that may affect your cluster
- The total filter
service = kubernetes, ensures that we are restricting our observation to the default kubernetes apiserver, and not any apiserver addons or plugins.
Monitor your SLOs
The admin dashboard lets you track SLO status at a glance when viewing SLOs. The SLO Status badge displays one of the following states:
Creating: You have just submitted your SLO for creation, this will take ~1-2mins to clear while aggregating dataNoData: Not enough data (usually no data) on the current metric to make any insights.OK: Your SLO has data and is on targetWarning: Your burn rate is elevated, therefore you should take a look at the comprehensive dashboardsBreaching: You have exceeded your target for this SLO's periodError: Non-recoverable internal server error. Restart the metrics backend or delete this SLO.
Opni alerting provides some comprehensive dashboards to monitor the status of your SLOs via Grafana that is set up by Opni Monitoring
Multi-Tenancy
Opni Alerting SLOs support multi-tenancy via opni-monitoring grafana access control, see here.
Operators with specific role permissions will only have access to the SLOs on the clusters they have been assigned by the admin's RoleBinding configuration.
After setting up your access control, you can head to your Opni cluster's Grafana deployment and open the Slo - Overview and Slo - Detailed for thorough dashboard breakdowns on your SLO's performance.
Multi-Cluster overview
The SLO Overview lets you quickly inspect the SLOs performance.
- View SLOs that are exceeding the burn rate filter that you can adjust
- View overall burn rate timeline and budget remaining
- View overall expected budget consumption
In depth overview
Ability to filter by cluster, service and name when viewing metrics of your SLOs.
- SLI perfomance
- Burn rate, error budget
- Alerts status
Core Concepts
Service Level Objective (SLO)
Unit : ratio/percentage
The target ratio/percentage, or threshold an SLI should have over its period.
An SLO is considered healthy if:
And breaching if:
Service Level Indicator (SLI)
Unit: ratio/percentage
A unit of measure to reflect a service's health, performance or reliability.
For Opni, an SLI is constructed on a specific service by comparing the rate of good events to the rate of all (total) events on the given service over the period of time it is defined on, for example 30 days.
An SLI of 1 (100%) indicates that the system is perfectly reliable, performant or healthy, while an SLI of 0 indicates that the system is completely unreliable, inoperable or unhealthy.
Error budget
Unit: ratio/percentage
The allowed amount of events that deviate from the good events over the period the SLI is defined on.
A remaining error budget of 100% means that the service has not encountered any bad events or failures.
Burn rate (ratio)
Unit: ratio/percentage
The (immediate) rate at which the error budget is being consumed by the system.
A burn rate between 0 and 1 (0-100%) corresponds to an SLI operating within its target and a burn rate > 1 (> 100%) indicates the target will be breached if the system continues consuming the budget at this burn rate.
where
and
Expected budget consumption
Unit: ratio/percentage
The estimated expected consumption of the budget over the SLI's period based on the observed error budget and burn rate.
For example, an expected error budget of 450%, means that based on current data, we expect to consume 4.5x the allowed error budget.
Further Reading
Our underlying SLO model uses the Multi-Window, Multi-BurnRate alerts method from Google's SRE Workbook.